


As the world is becoming more interconnected, individuals and businesses often need real-time and historical exchange rates. From financial analysis and mitigating financial risks to international tourism, e-commerce transactions, and international trade, Forex (Foreign exchange) rates data is an indispensable resource in various situations. Since currency rates can go up and down within minutes, getting accurate real-time exchange rates is imperative. Moreover, investors often need historical exchange rates to analyze trends and patterns over the years. One popular tool that can help you get real-time and historical exchange rates is MS Excel.
Excel spreadsheets are an advanced and versatile tool with countless applications, and working with currency data is one of them. You can calculate exchange rates, compare currencies, or even create a currency converter. However, getting exchange rates in Excel can be overwhelming as it involves working with the data stocks feature. Fortunately, you can use a reliable exchange rates data API to make this process simpler and quicker. Moreover, using an API for exchange rates also provides more accurate results.
This article will discuss the process of getting exchange rates in Excel using its data stocks feature. Then, we’ll also show you how this can be done much more efficiently using a powerful exchange rates API like Fixer. Let’s get started.
Table of Contents
How to Get Exchange Rates in Excel Using Its Built-in Features?
Entering a Currency Pair
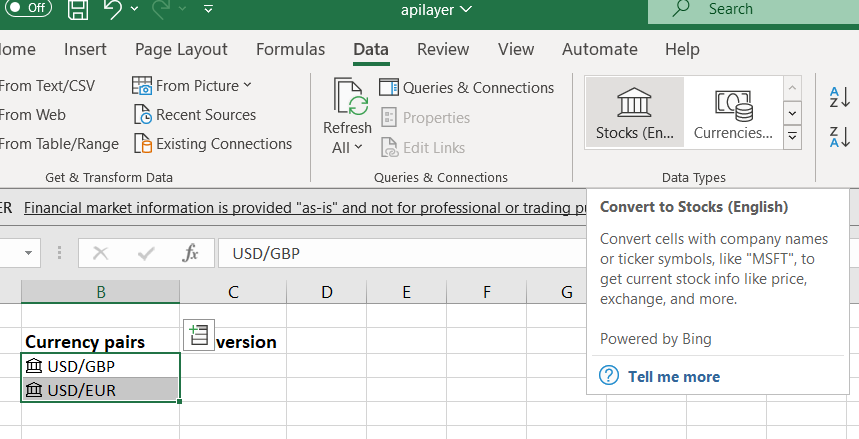
First, open an Excel sheet and enter your desired currency pair using their ISO currency codes. For example, if you want to convert United States currency to Great Britain currency, you’ll use USD to GBP. This will give you the exchange rate from 1 USD dollar to the UK pound. The correct currency conversion format for Excel is USD/GBP. Similarly, you can convert a Canadian dollar to US Dollar or an Australian Dollar to US Dollar and more. You can also separate currencies by a colon, dash, or space.
Adding Data Type for Currencies
We’ll use Excel’s stock feature that provides daily updated currency exchange rates. First, we’ll add data type for each currency. To do so, select the cells where you inserted your desired currency pairs. Next, go to the ‘Data’ tab and select ‘Stocks.’ Excel will then convert your currencies into a data type and show a stock icon in the relevant cells. However, if you’ve used an incorrect format or currency code, it’ll show a question mark symbol. In such a case, identify and correct the mistakes and press enter.

Getting and Comparing Exchange Rates
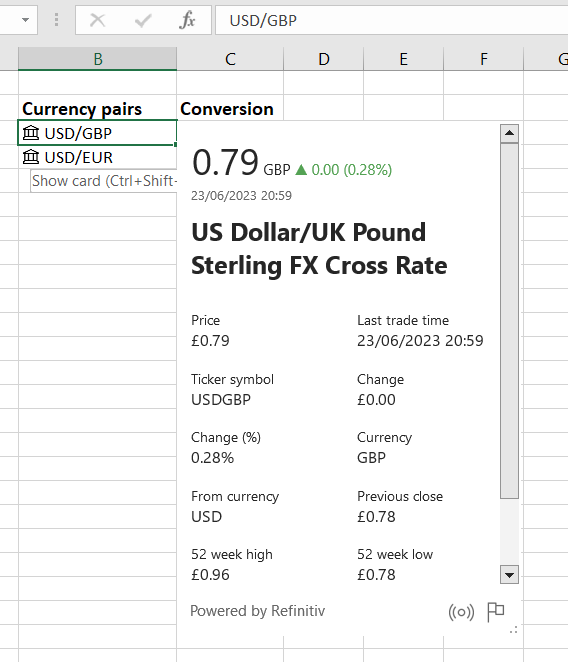
Now that we’ve added a data type for currencies, we can get our desired currency or exchange rate information. Select a currency pair and click on the ‘Stocks’ icon. You’ll see a card consisting of information regarding how two currencies relate. You can also get this information by right-clicking on the cell and clicking ‘Show Data Type Card,’ or you can use this shortcut CTRL + Shift+F5.

To get the information in the card in Excel columns, click on the ‘Insert Data’ icon on the right. Doing this will show you all the available options.

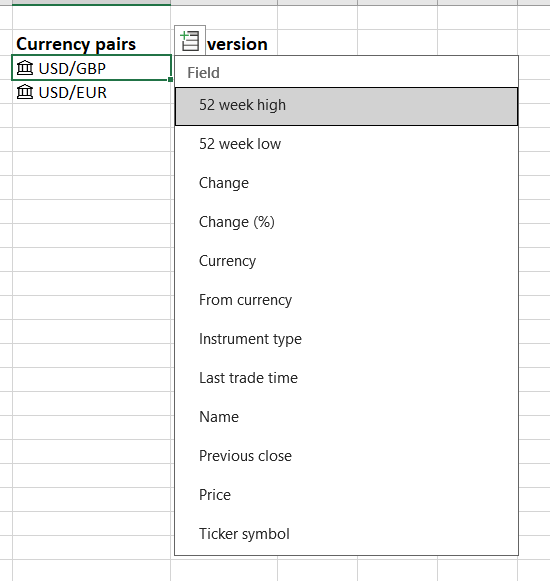
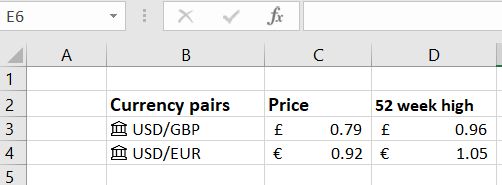
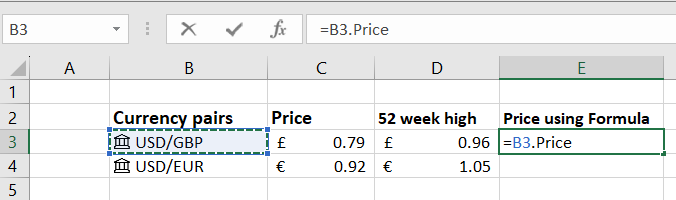
Select your desired field, and the data will automatically appear in a new column. For example, you can get the exchange rate for the currency pair by selecting ‘Price.’ This means the price column for USD/GBP will show how much one US Dollar is in the British Pound. Similarly, you can use ’52 week high’ to see the highest value in the last 52 weeks.

Using Formula to Get Exchange Rates
You can also use an Excel formula to get your desired exchange rates. For example, you can type = in a cell, then click the column containing the currency pair and choose your desired field, such as ‘Price’ or ‘52 week high’. The formula, in our case, will be =B3.Price.

You can now use this currency data as needed. One key point to note here is that this data won’t refresh on its own, meaning once you’ve inserted data, you’ll need to refresh it repeatedly to get real-time exchange rates. You can refresh the data manually by clicking ‘Refresh all’ in the Data tab.
Getting Historical Exchange Rates in Excel
To get historical exchange rates, you can use the STOCKHISTORY function. You can use this function to get the exchange rate for a certain period. Here is a sample formula to get historical exchange rates:
=STOCKHISTORY(“USD/GBP”,DATE(2019,07,24),,,0,1).
How to Get Real-Time and Historical Exchange Rates in Excel Using an Exchange Rates Data API?
Using Excel’s built-in stock feature, you can get as-is exchange rates. But what do you do when you want real-time and the most up-to-date exchange rates? You can use a reliable exchange rates API to import and update real-time exchange rates. The best part is that you don’t necessarily need programming skills to get exchange rate data in Excel using an API.
Choosing an Exchange Rates API
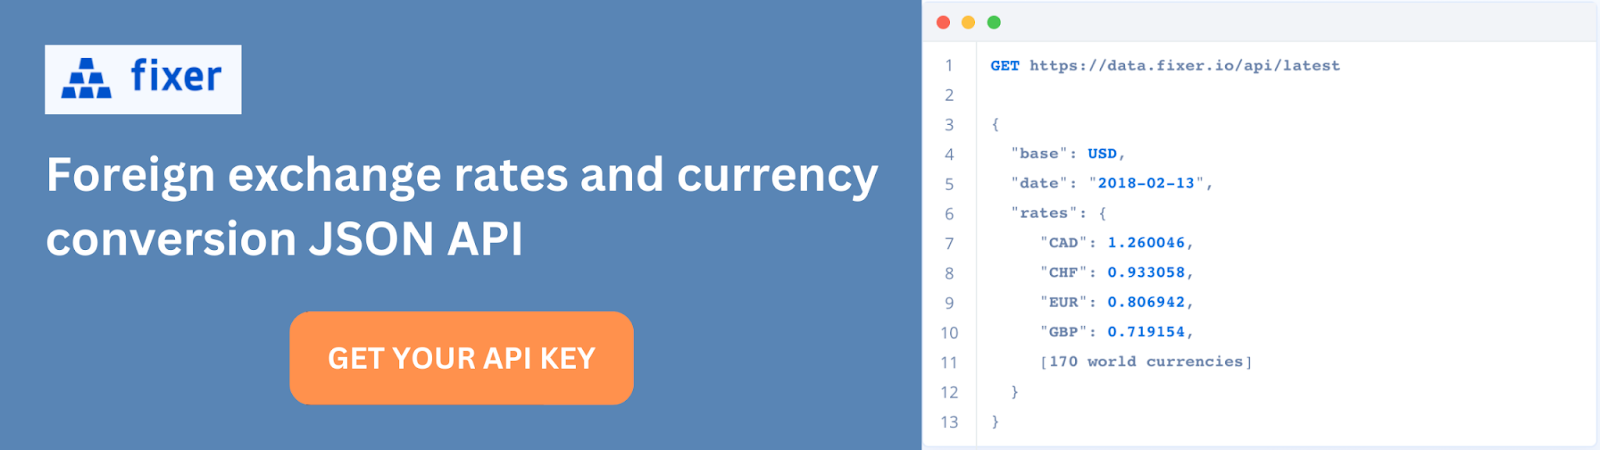
Here, we’ll be using Fixer API for various reasons. Firstly, it provides the most accurate real-time exchange rate data, updated every 60 seconds. It also offers historical exchange rates all the way back to the year 1999. Moreover, the API supports 170 world currencies, meaning you can get exchange rates for just about any currency. Not to mention the API also comes with a free plan that gives you 1000 API calls per month and supports historical rates and hourly updates.
Here are other notable features of the API:
- You can choose to update live data every 60 minutes, 10 minutes, or every 60 seconds.
- The API uses rock-solid sources, such as reliable financial data providers and banks, including the European Central Bank, to provide highly-accurate data.
- The API returns data in JSON format, which is lightweight and easy to understand.
- Fixer API encrypts your connection to the API using bank-grade 256-bit SSL Encryption.
- In addition to real-time exchange rates, Fixer offers separate endpoints for single currency conversion and Time-Series data. With the time-series endpoint, you can get daily historical rates between any two dates of your choice, with a maximum period of 365 days.
- The API is highly scalable and returns results within milliseconds.
- The API has detailed documentation consisting of all the details about the API endpoints. It has code examples in various programming languages to help you get started quickly.
Getting Real-Time Currency Rates in Excel
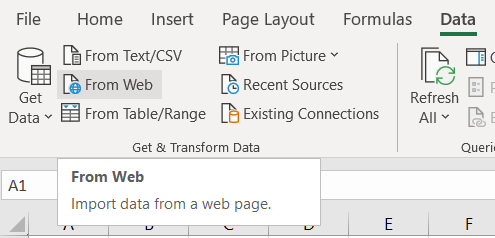
First, we need to create a web query that’ll allow us to fetch exchange rate data from the API. To do so, select the Data tab, then choose the option ‘From Web.’

Next, you’ll need to enter your API key using the API base URL, which is unique to each user. To get your Fixer API key, subscribe to your desired plan by providing the required information, such as your email ID, name, county, city, etc.

Once you have your API key, you can enter the API key with the base URL using the following format (replace ‘‘API_Key’ with your unique API key):
https://data.fixer.io/api/latest?access_key=API_Key
With Fixer API, the default base currency is EUR. However, you can change it as follows:
https://data.fixer.io/api/latest?access_key=API_KEY&base=USD
(If you use the free plan, use ‘http’ prefix instead of ‘https’ since the free plan does not support the SSL encryption.)

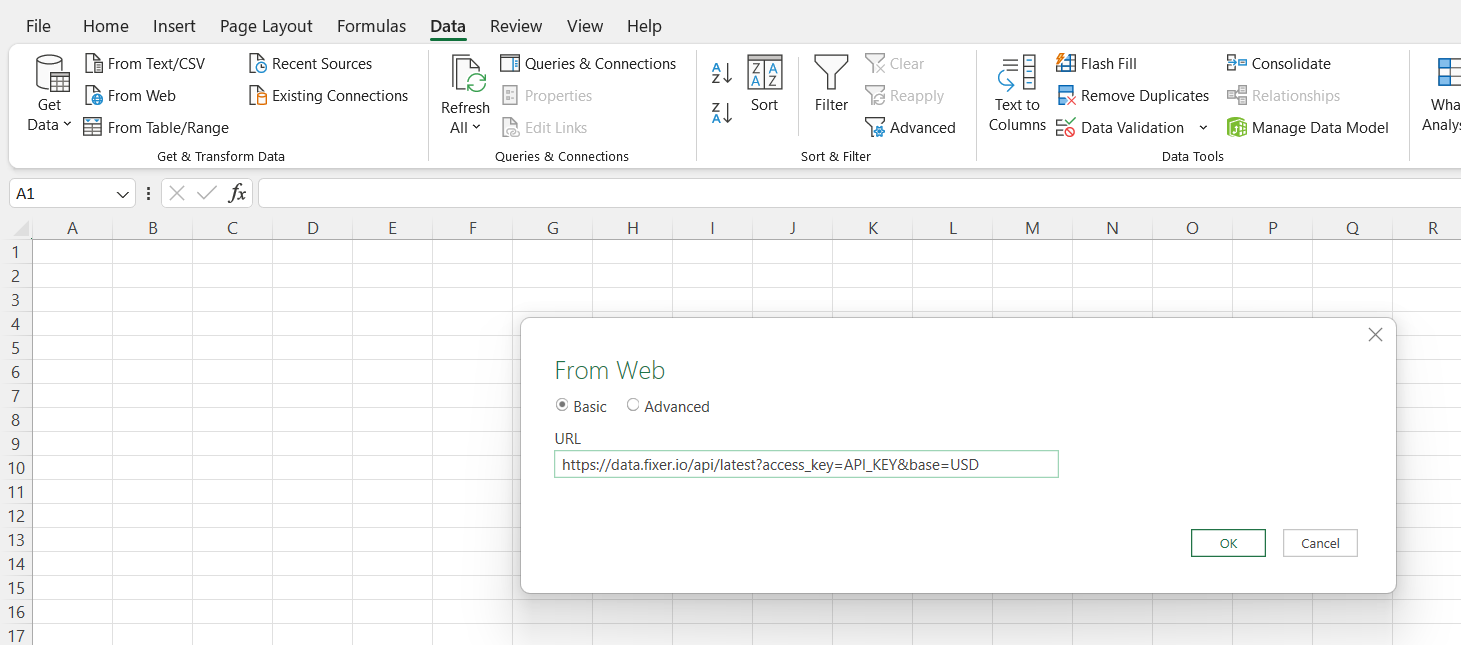
Once you enter your API key and run the query in Excel, it’ll direct you to another window.

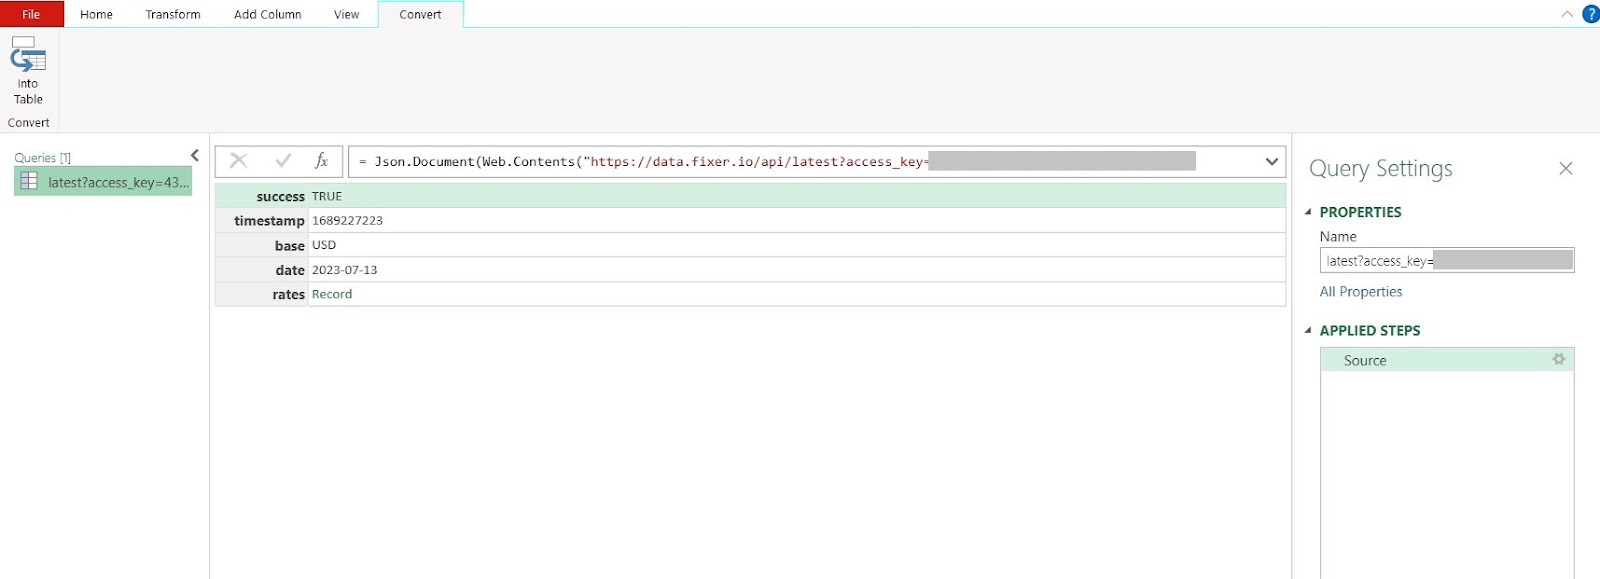
Right-click on Record, then select ‘Drill down.’

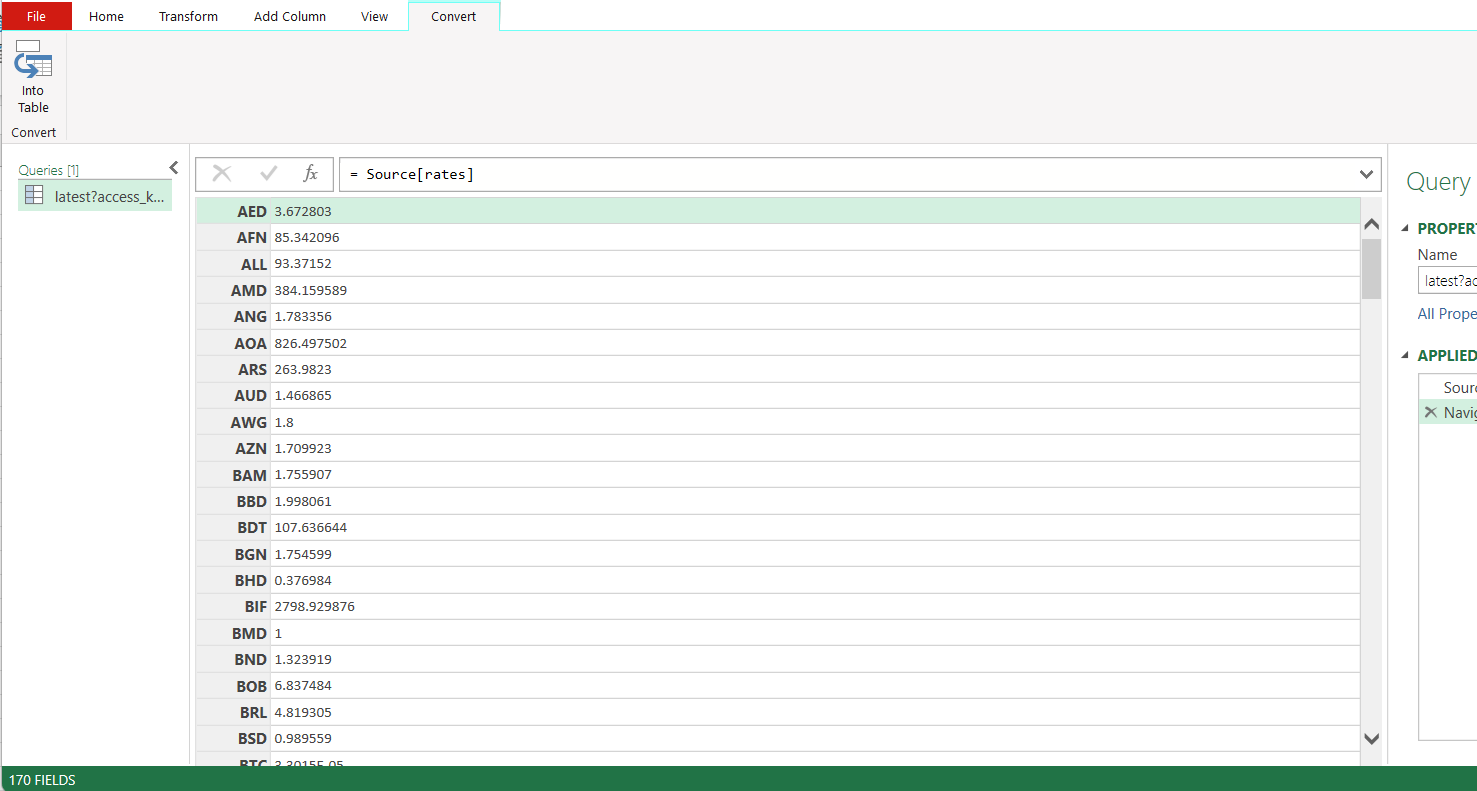
Now click the button ‘Into Table.’ Now you’ll have the latest exchange rate in the table.

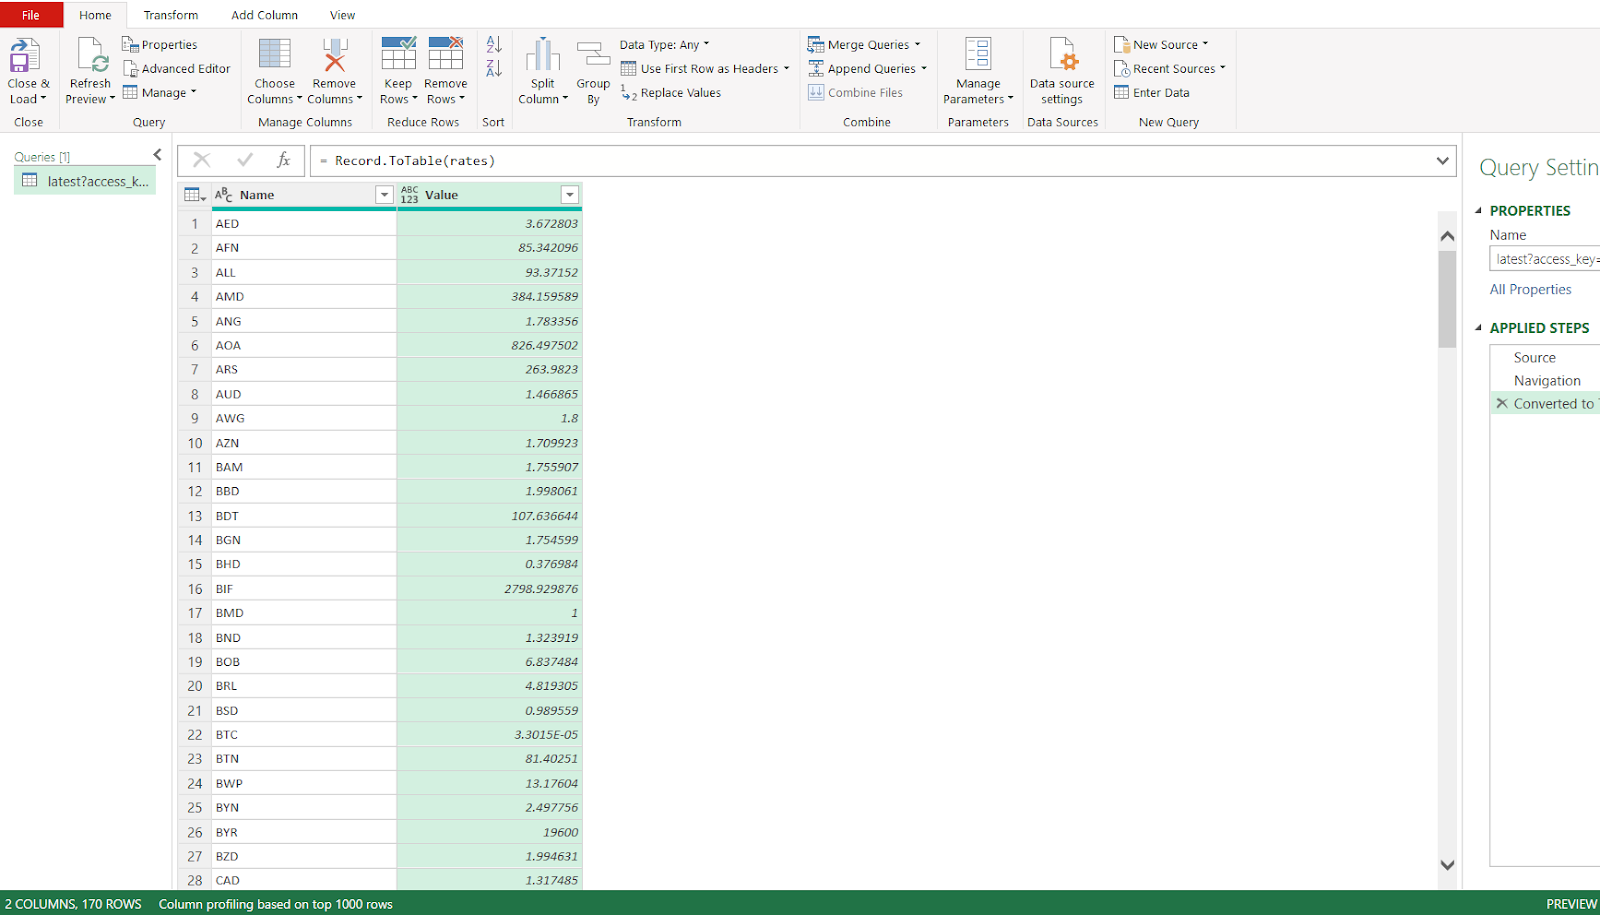
Click ‘Close and Load’ in the Home tab, and the rates will load in your Excel spreadsheet.

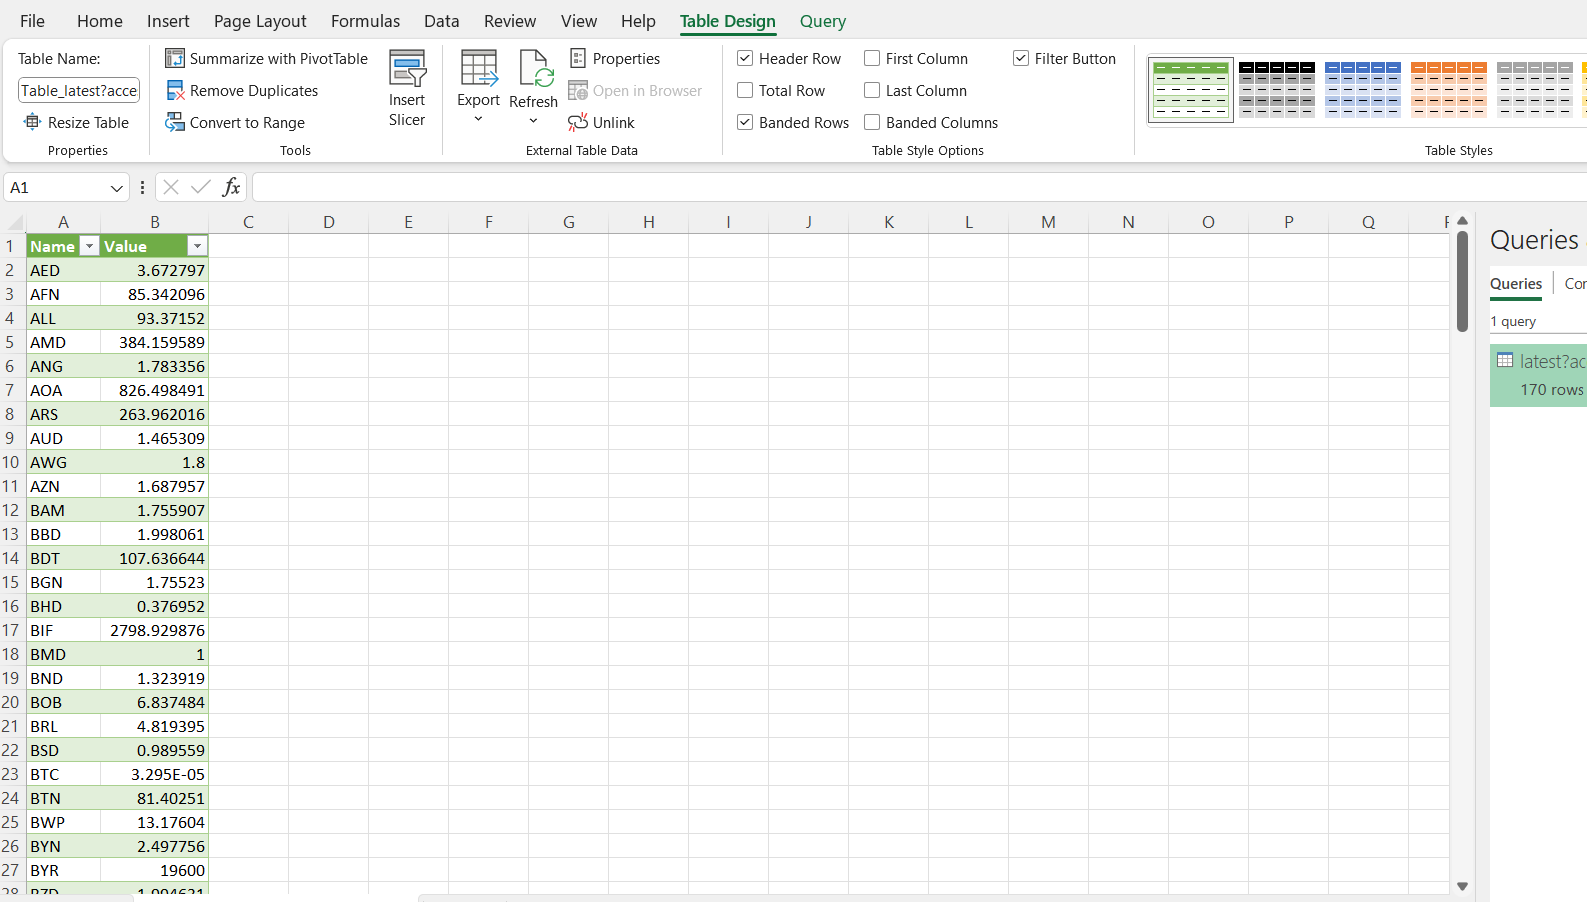
That’s it! You see how easy it is to get accurate and the most up-to-date data using an API compared to Excel’s built-in feature.
You can also get historical exchange rates using Fixer’s historical endpoint. Here is a sample code:
https://data.fixer.io/api/2013-12-24
    ? access_key = API_KEY
    & base = GBP
What Are Other Use-Cases of Fixer API?
From Microsoft to Samsung, thousands of large corporations, developers, and SMBs use Fixer for various purposes. Fixer can be used:
- For creating a currency converter app
- For Currency trading app
- By businesses that sell products in various countries
- By companies that buy products from other countries
- For Stock and Forex trading
- For Digital banking
- By E-Commerce platforms
- By investors to get historical rates and understand exchange rate fluctuation
Frequently Asked Questions (FAQs)
1. How do Excel’s built-in currency features compare with using an API for accuracy and reliability?
Excel’s built-in currency features rely on static data that may not always be up-to-date, whereas using an API like Fixer ensures you get real-time exchange rates. APIs generally offer better accuracy and reliability, especially for businesses with fluctuating exchange rates.
2. Can I automate exchange rate updates in Excel without refreshing manually?
Yes, you can automate exchange rate updates in Excel by integrating an API such as Fixer. This eliminates the need for manual updates, ensuring your data is always accurate and up-to-date.
3. What are the benefits of using Fixer API for businesses with international transactions?
For businesses dealing with international transactions, the Fixer API offers real-time exchange rate data, allowing for more accurate pricing, billing, and financial reporting. It helps businesses make informed decisions based on the latest exchange rates, reducing the risk of currency fluctuations.
4. How can developers integrate Fixer API with other applications beyond Excel?
Developers can integrate the Fixer API with various applications using standard API protocols. This can include ERP systems, financial software, or even eCommerce platforms to provide real-time currency conversion or pricing updates.
5. Is Fixer API secure enough for financial applications, and how does SSL encryption work in this context?
Yes, Fixer API uses SSL encryption to ensure the security of your data. SSL (Secure Sockets Layer) encrypts the data transferred between your application and the API server, protecting sensitive information from potential threats during transmission.
Start Getting Real-Time Exchange Rates in Excel Today!
Don’t let outdated currency data slow you down. Sign up for Fixer API and get access to accurate, real-time exchange rates directly in your Excel spreadsheets. Whether you’re tracking international transactions, analyzing trends, or managing e-commerce pricing, Fixer makes it easy. Try Fixer for free now and experience the difference!