


Picking a weather API feels simple until you start building. You pull current conditions for a city and everything works. Then you need hourly forecasts for 200 locations or historical data for a compliance report, and you realize not every API handles those requirements the same way.
This guide covers the factors that matter: accuracy, coverage, update frequency, forecast horizons, and cost. You will also find eight real use cases and production best practices you can apply on day one.
Table of Contents
Key Takeaways
- Use case first. Current conditions, forecasts, and historical data serve different products. Pick an API that matches your need.
- Accuracy degrades with time. A 24-hour forecast is far more reliable than a 14-day one. Plan your UX accordingly.
- Coverage gaps exist. Global coverage does not guarantee uniform station density. Test remote locations before you commit.
- Update frequency drives freshness. An API refreshing every 15 minutes is fine for travel apps but too slow for severe weather alerts.
- Production reliability is key. Caching, retries, rate limit handling, and timezone normalization prevent outages.
- Cost scales with calls. Free tiers work for prototyping. Forecast your monthly volume before choosing a plan.
What Is a Weather API?
A weather API is a REST endpoint that returns structured weather data as JSON. You send a location (city name, coordinates, ZIP code, or IP address) and get back temperature, humidity, wind speed, precipitation, and other conditions.
Most APIs group their data into four categories:
- Current conditions: Real-time temperature, wind, pressure, visibility, and more.
- Forecast: Hourly or daily predictions for the coming 1 to 14+ days.
- Historical: Archived observations, often going back years or decades.
- Alerts: Government-issued severe weather warnings (not available from every provider).
The Weather API Evaluation Checklist
Before you integrate any weather API, run it through this checklist. The table below gives a quick reference; sections that follow expand on each criterion.
Criterion | What to Check | Why It Matters |
Accuracy | Source models, station density, verification reports | Determines trust in your product’s data |
Coverage | Number of locations, coordinate support, remote area handling | Gaps mean blank screens for your users |
Update Frequency | Refresh interval for current vs. forecast data | Stale data causes poor decisions |
Forecast Horizons | Hours, days, and granularity (hourly vs. daily) | Defines how far ahead your app can plan |
Data Types | Current, hourly, daily, historical, astronomy | Feature scope depends on available endpoints |
Units & Localization | Metric/imperial toggle, language, timezone info | Saves you from writing conversion logic |
Reliability | Uptime SLA, consistent JSON schema, error codes | Downtime = broken user experience |
Limits & Cost | Free tier cap, paid plan pricing, overage fees | Unexpected bills or throttled requests hurt |
Table 1: Weather API Evaluation Checklist
Accuracy Explained
Forecast accuracy is not a single number. It depends on three variables: the weather parameter (temperature is easier to predict than precipitation), the forecast horizon (3 hours is more reliable than 10 days), and geography (flat terrain beats mountainous or coastal areas).
Most providers source data from national meteorological services, satellites, radar networks, and ground stations. This raw data passes through numerical weather prediction (NWP) models.
Think of accuracy as a confidence gradient. The first 48 hours carry high confidence. Beyond 7 days, treat data as directional. Beyond 10 days, display it with clear caveats.
Coverage and Location Resolution
When a provider says it covers “millions of locations,” that number usually refers to named cities in their geocoding index. The actual data comes from weather stations, satellites, and model output interpolated to your requested point.
Station density varies. Urban areas in Europe and North America have excellent coverage. Rural Africa, central Asia, and parts of South America have thinner networks, meaning the API interpolates from more distant observations.
Tips for handling coverage:
- Prefer coordinates over city names. Lat/long removes ambiguity. “Springfield” matches dozens of cities; coordinates do not.
- Add country qualifiers. If using city names, append the country (“London, United Kingdom” vs. “London, Ontario”).
- Test edge cases. Query a handful of remote locations before committing. Check that responses contain real data, not fallbacks to the nearest large city.
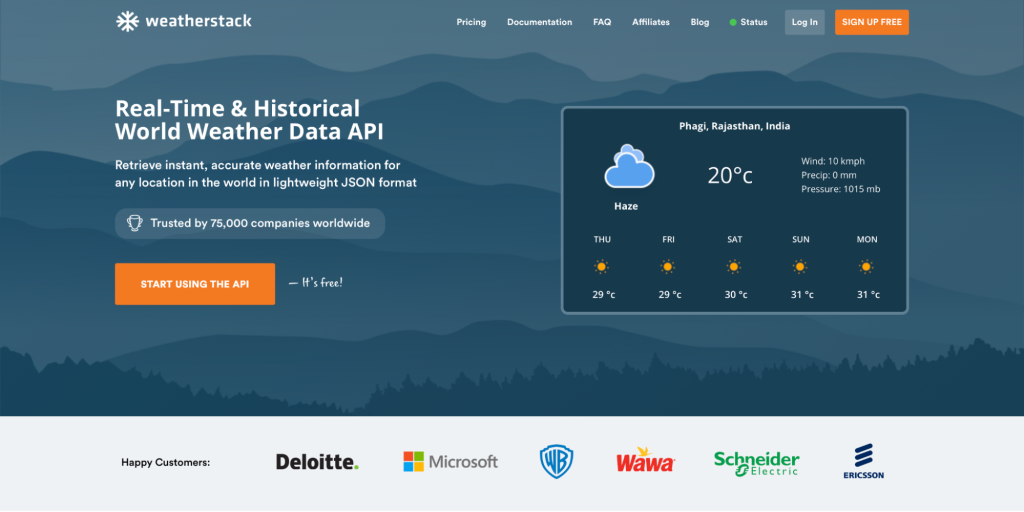
Weatherstack supports lookup via city name, ZIP/postal code, coordinates, and IP-based geolocation, which is useful for auto-detecting a visitor’s location.

Update Frequency and Latency
Update frequency defines how often the API refreshes its data. Most current-condition endpoints refresh every 5 to 15 minutes. Forecast endpoints typically update every 1 to 6 hours, depending on the underlying model schedule. Historical data does not change after the fact.
If you build a severe weather alerting system, a 15-minute refresh cycle means users could see warnings 15 minutes late. For a travel app, that delay is fine.
Match your polling cadence to the refresh rate. Calling every 60 seconds when data updates every 10 minutes wastes quota. Cache and re-fetch at the actual interval.
Forecast Horizons and Timeframes
A forecast horizon is how far into the future the prediction reaches. A “3-day forecast” has a 72-hour horizon. Most APIs offer two granularity levels: hourly and daily.
- Hourly forecasts give temperature, precipitation probability, and wind for each hour. Most useful within the first 48 to 72 hours.
- Daily forecasts summarize highs, lows, and overall conditions. Useful out to 7 to 14 days, though confidence drops steadily.
Weatherstack provides forecasts up to 14 days, with hourly breakdowns on Professional plans and above.
Timestamp tip: Store forecast timestamps in UTC and record the timezone offset separately. This prevents daylight saving bugs and simplifies local time display.
Dashboards and Forecast Views
Teams across logistics, agriculture, energy, and operations build internal weather dashboards. Here is a pipeline that works for most setups:
The Data Pipeline

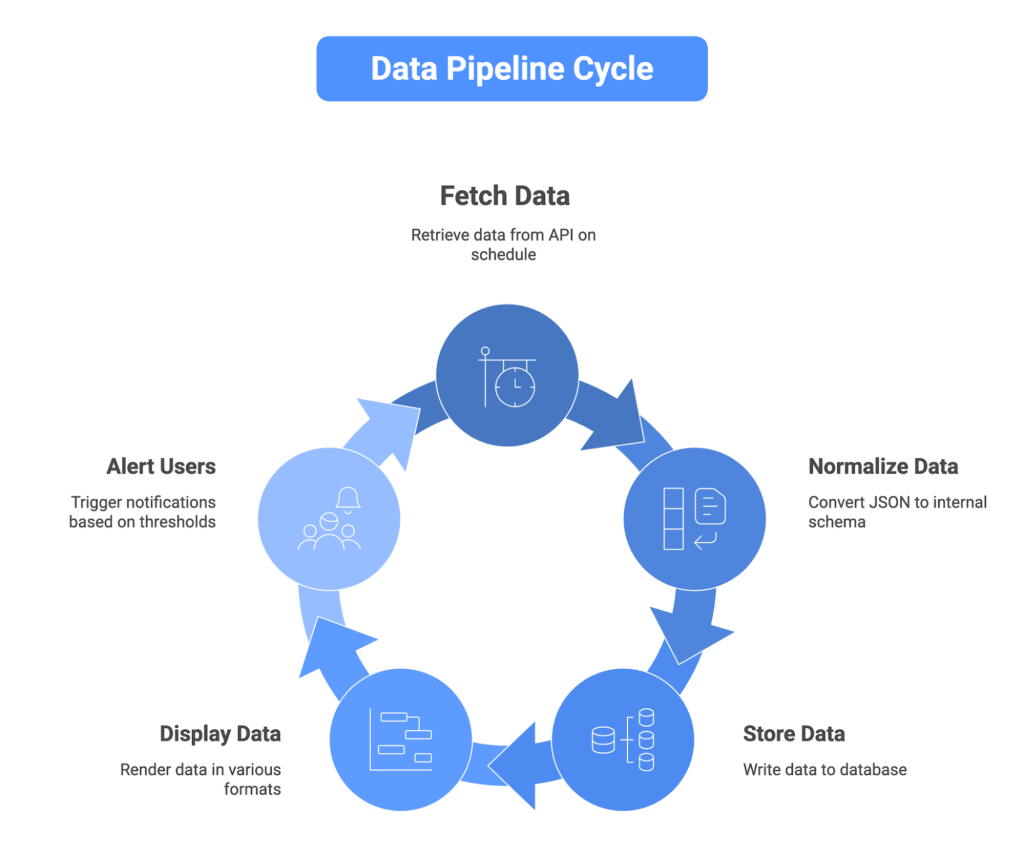
Fetch: Call the API on a schedule (every 15 min for current data, every 2 hours for forecasts).
Normalize: Convert JSON to your internal schema. Standardize units, flatten nested objects, add UTC timestamps.
Store: Write to a database. Simple schema: location_id, timestamp_utc, timezone, data_type, and a JSON payload column.
Display: Render current conditions as a card, hourly data as a timeline, and daily forecasts as a 7-day strip.
Alert: Set threshold rules (wind > 50 km/h, temp < 0, precip > 80%). Trigger notifications via email, Slack, or push.
Keep fetch and display layers separate. If the API goes down, your dashboard should show cached data with a “last updated” timestamp.
Real Use Cases of Weatherstack API
Here are eight scenarios where weather APIs power real products:
Use Case | How Weather Data Is Used | Primary Data Type |
Weather Widget / Consumer App | Display current temp, conditions, and a short forecast on a homepage or mobile screen | Current + Daily Forecast |
Travel & Hospitality | Show destination weather for trip planning; auto-suggest packing lists | Daily Forecast (7-14 day) |
Logistics & Delivery | Route around storms, adjust ETAs, warn drivers of icy conditions | Hourly Forecast + Alerts |
Construction / Field Ops | Decide whether to pour concrete or schedule outdoor work; track rain windows | Hourly Forecast + Historical |
Energy & Utilities | Predict heating/cooling demand, manage renewable generation (solar, wind) | Hourly Forecast + Historical |
Agriculture | Monitor frost risk, schedule irrigation, predict harvest windows | Hourly + Daily + Historical |
Event Planning & Staffing | Decide on tent rentals, outdoor vs. indoor plans, staff scheduling | Daily Forecast (7-14 day) |
Insurance & Risk Analytics | Correlate claims with historical storms; model exposure for underwriting | Historical + Current Alerts |
Table 2: Real Use Cases of Weatherstack API
Best Practices for Production Integrations
Getting data from a weather API is the easy part. Keeping it reliable in production is where teams hit friction.
Caching Strategy
Cache current conditions for 10 to 15 minutes. Cache forecasts for 1 to 2 hours. Cache historical data aggressively. Use a key pattern like weather:{location_id}:{data_type} in Redis or Memcached.
Rate Limit Handling
When you receive an HTTP 429, back off exponentially. Start with a 1-second delay, double it on each retry up to 60 seconds. Log every 429 so you can adjust polling frequency before it becomes recurring.
Monitoring
Track three metrics: API response time (p50, p95), error rate (4xx and 5xx), and data freshness (time since last successful update per location). Set alerts on all three.
Data Normalization
Pick a single unit system (metric is safer for global products) and convert at the APILayer. Store all timestamps in UTC. Map provider-specific field names to your internal schema so you can swap providers without rewriting display logic.
Do / Don’t Reference
Do | Don’t |
Cache responses by data type and TTL | Hit the API on every page load |
Use coordinates for precise lookups | Pass ambiguous city names without a country |
Store timestamps in UTC | Rely on local server time for scheduling |
Implement exponential backoff on 429s | Retry immediately in a tight loop |
Monitor error rates and latency daily | Assume the API is always available |
Normalize units at the APILayer | Convert units in multiple frontend components |
Table 3: Do / Don’t Reference
Putting It Into Practice With Weatherstack
Weatherstack (built by APILayer) is a REST API that covers current conditions, forecasts up to 14 days, and historical data back to 2008. It accepts queries by city name, coordinates, ZIP/postal code, or IP address and returns clean JSON.
Key practical features:
Free tier: 100 monthly requests on the Free plan let you test integration logic before spending anything.
Hourly breakdowns: Professional plans include hour-by-hour data for logistics, agriculture, and alert-driven products.
Bulk lookups: A single call returns data for multiple locations, reducing round trips.
Unit control: Pass a units parameter (m for metric, f for imperial, s for scientific) to get data in your preferred format.
For a forecast dashboard, Weatherstack’s forecast endpoint with a cron job and time-series store gives you a production-ready pipeline quickly. Add historical data for trend analysis, and you have a full weather layer.
Conclusion
Choosing a weather API is a product decision, not just a technical one. The right pick depends on what data types you need, how fresh that data must be, where your users are, and what your monthly request volume looks like.
Test two or three providers against your real locations and data requirements. Pay attention to accuracy at longer horizons, behavior under rate limits, and normalization ease.
For most developer and enterprise use cases, Weatherstack covers the critical bases: current, forecast, and historical data with clean JSON, flexible location input, and straightforward pricing. Try the free tier, validate it, and scale from there.
FAQ
What is the best weather API for forecasts?
It depends on your forecast horizon and geographic focus. For general-purpose apps needing current conditions plus a 7 to 14-day outlook, APIs like Weatherstack offer solid coverage, clean docs, and affordable pricing. For research-grade NWP model output, Open-Meteo or Meteomatics may fit better.
How accurate are 7-day forecasts?
Temperature forecasts for days 1 through 3 are typically within 1 to 2 degrees Celsius. By day 7, the margin widens to 3 to 5 degrees. Precipitation forecasts degrade faster. Treat anything beyond 5 days as a general trend.
How often should I refresh weather data?
For current conditions, every 10 to 15 minutes. For forecasts, every 1 to 2 hours. For historical data, cache indefinitely.
What matters more: coverage or update frequency?
That depends on your product. A global travel app needs wide coverage first. A fleet management tool serving one region needs fast updates and alerts. Prioritize the factor your core user experience depends on.
How do I build a simple forecast dashboard from an API?
Set up a scheduled task (cron or cloud function) that calls the forecast endpoint every 1 to 2 hours. Normalize the response and store it in a database. Build a frontend that reads from your database, not the API directly. Display current conditions, an hourly timeline, and a daily strip. Add threshold-based alerts for wind, rain, or temperature. This keeps your dashboard fast and decoupled from the API’s availability.