A currency converter is one of the most useful small tools you can build. Everyone who shops online from another country, gets paid in a foreign currency or sends money home has typed “100 dollars to euros” into a search box at some point. Underneath, every converter does the same thing. It fetches a table of exchange rates from an API, does a little arithmetic and formats the result. The arithmetic is where most first attempts go a little wrong, and so is the caching.
I recently built one, GlobalRates, on top of the Exchange Rates Data API from APILayer. It converts between 170 or so currencies, shows quick reference tables and a 12-month chart, and lists the day’s financial news for the pair you’re looking at. In this article I’ll cover the API first, with real requests and responses, and then show how I’d vibe code the whole thing with an AI assistant.
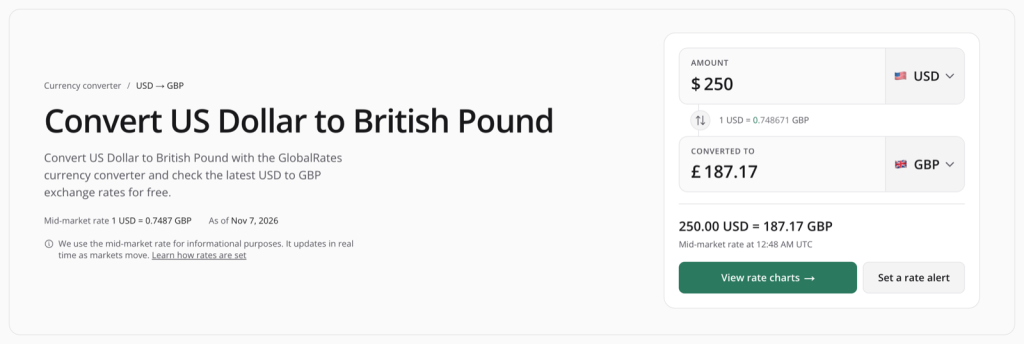
250 USD to GBP in GlobalRates. The 0.748671 rate is a cross rate computed on the server from one cached EUR-based table, which is the technique this article walks through.
Table of Contents
What is an exchange rate API?
An exchange rate API gives you the current value of one currency in terms of others, as structured data you can use in code. You ask for the latest rates, and you get back a base currency and a list of rates against it, along with a timestamp telling you how fresh they are.
The rates these APIs publish are mid-market rates. The mid-market rate is the midpoint between what buyers are paying for a currency and what sellers are asking on the global markets at that moment. It’s the fairest reference rate there is, and it’s what banks and transfer services start from before adding their own margin. That’s why a converter built on an API like this shows a slightly better rate than your bank does, which I’ll come back to later.
The Exchange Rates Data API has a handful of endpoints. latest returns current rates, a date in the path returns rates for that day, timeseries returns a daily series between two dates, fluctuation returns how much rates moved over a period, and symbols returns every supported currency with its full name. Which of those you can use depends on your plan, so it’s worth looking at the plans before you design anything.
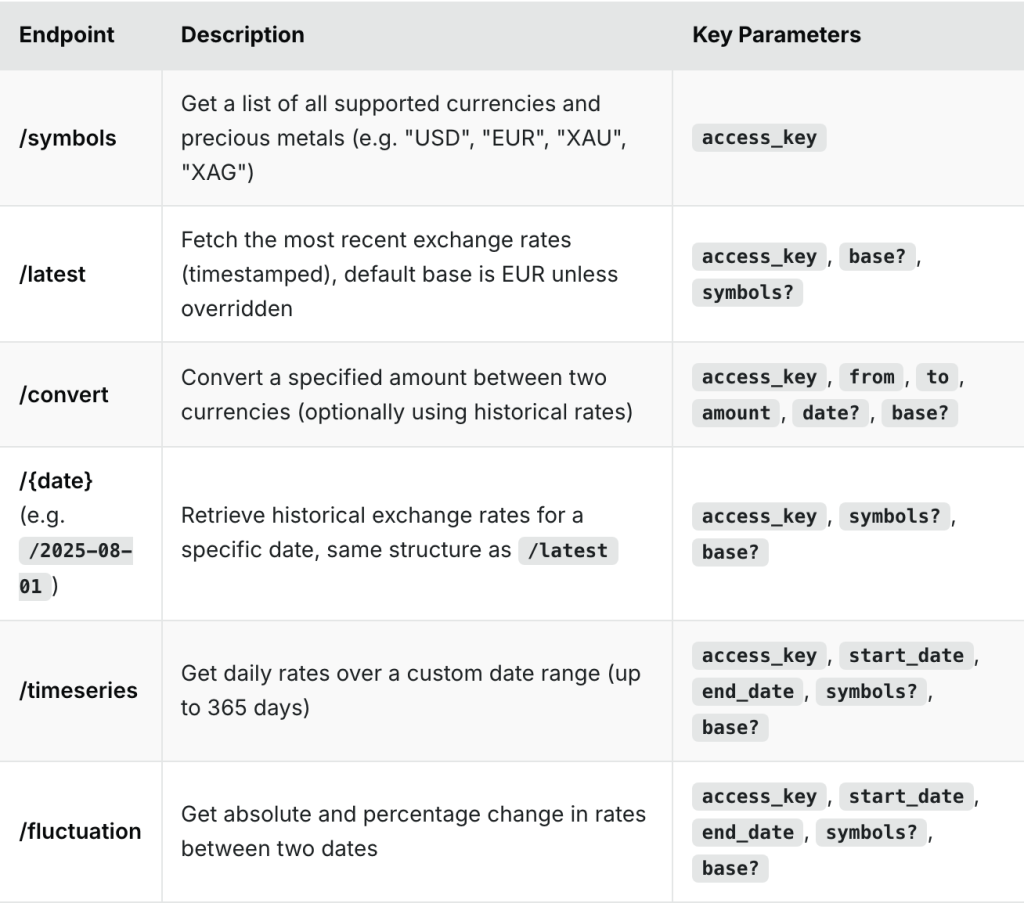
The endpoint summary from the API documentation. Note that latest defaults to an EUR base; on the free plan that default can’t be overridden.
The free plan gives you 100 requests a month for non-commercial use, with historical rates included, but rates always come back against the euro and requests go over plain HTTP. The Basic plan adds switching the base currency, the convert endpoint and HTTPS.
Time series queries start on Professional, and the currency change queries behind fluctuation start on Business. Update frequency improves with each tier as well, down to every 60 seconds on Business.
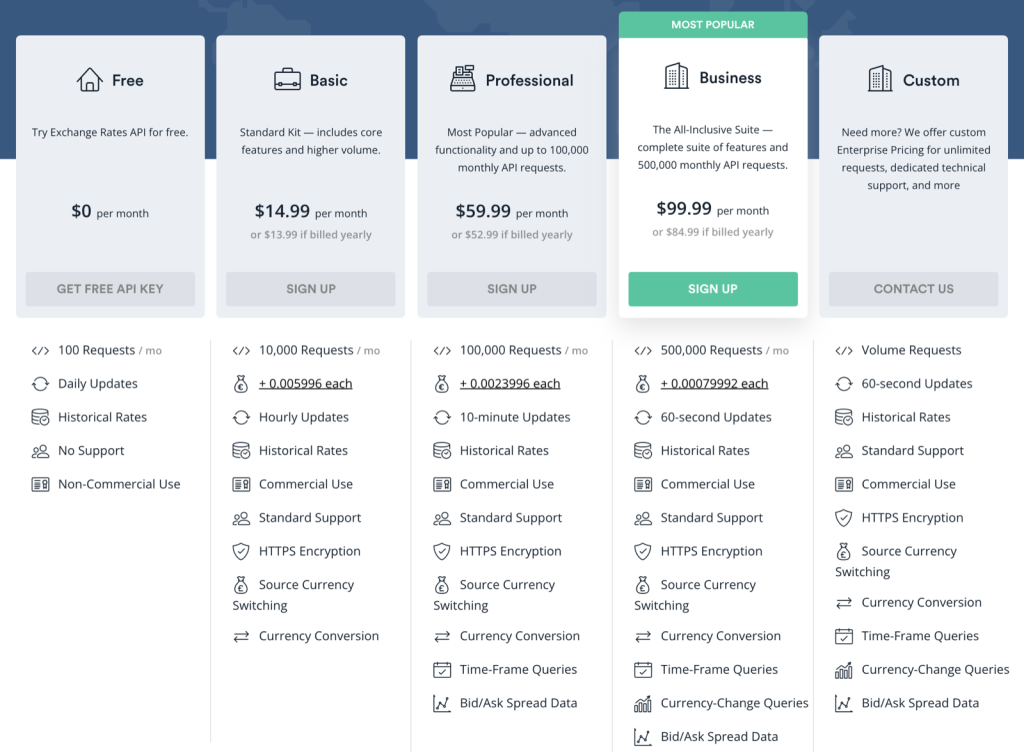
The plan matrix on the pricing page. The rows that shape your architecture are request volume, update frequency, Source Currency Switching (base), Time-Frame Queries (timeseries) and Currency-Change Queries (fluctuation).
How do you get the latest exchange rates?
You call the latest endpoint with your access key and, optionally, a symbols parameter listing the currencies you care about. After signing up at exchangeratesapi.io and copying the key from the dashboard, this is the request:
curl "http://api.exchangeratesapi.io/v1/latest?access_key=YOUR_KEY&symbols=USD,GBP,NGN,JPY,INR,CAD"
And this is what came back:
					{
  "success": true,
  "timestamp": 1793891166,
  "base": "EUR",
  "date": "2026-11-05",
  "rates": {
    "USD": 1.121265,
    "GBP": 0.83324,
    "NGN": 1509.45788,
    "JPY": 177.277074,
    "INR": 105.971443,
    "CAD": 1.568437
  }
}
Each number in rates is how much of that currency one euro buys. So one euro was worth about 1.12 US dollars and about 1,509 Nigerian naira at the time of this request. The timestamp is a Unix timestamp for when the rates were captured, here 15:06 UTC on 5 November 2026, and it’s worth showing on your page as “rates as of”, because people care how fresh a rate is.
If you leave out symbols, you get every currency at once. For a converter that’s usually what you want, because one call then covers every pair a visitor might choose, and you can cache that single table instead of making a request per conversion.
Errors come back as a JSON object with an error block. An invalid key, for example, returned a 401 status with {“error”: {“code”: “invalid_access_key”, “message”: “You have not supplied a valid API Access Key…”}}. Successful responses include “success”: true, so check for that flag and for the error object before you trust rates, and your page can explain what went wrong instead of showing zeros.
Explore APILayer Products
Discover APIs for geolocation, finance, aviation, weather, web scraping, AI, and more. Browse APILayer's product catalog to find the right APIs for your application and integrate the data and functionality your project needs.
Explore APILayer ProductsFind the right tools to start building.
How do you convert between two currencies on the free plan?
You divide one rate by the other. Because every rate in the table is measured against the same base, the rate from currency A to currency B is the rate for B divided by the rate for A. This is called a cross rate, and it’s how you convert any pair even though the free plan only returns euro-based rates.
Using the response above, one US dollar in naira is 1509.45788 divided by 1.121265, which is about 1,346.21. One British pound in US dollars is 1.121265 divided by 0.83324, about 1.3457. Converting from euros is the simplest case, because the euro’s own rate is 1, so 100 euros is just 100 times the rate. Add EUR: 1 to the table before you start, since the API doesn’t list the base currency in its own rates.
In code it’s a few lines on the server:
					// app/api/convert/route.ts
let cache: { at: number; rates: Record<string, number>; timestamp: number } | null = null;
const TTL = 30 * 60 * 1000; // reuse one rate table for 30 minutes

async function getRates() {
  if (cache && Date.now() - cache.at < TTL) return cache;
  const res = await fetch(`http://api.exchangeratesapi.io/v1/latest?access_key=${process.env.EXCHANGERATES_API_KEY}`, { cache: "no-store" });
  const data = await res.json();
  if (!data.success) throw new Error(data.error?.message ?? "Rates unavailable");
  cache = { at: Date.now(), rates: { ...data.rates, EUR: 1 }, timestamp: data.timestamp };
  return cache;
}

export async function GET(req: Request) {
  const p = new URL(req.url).searchParams;
  const from = p.get("from")?.toUpperCase() ?? "";
  const to = p.get("to")?.toUpperCase() ?? "";
  const amount = Number(p.get("amount"));
  if (!from || !to || !Number.isFinite(amount)) return Response.json({ error: "Pass from, to and amount" }, { status: 400 });

  const { rates, timestamp } = await getRates();
  if (!rates[from] || !rates[to]) return Response.json({ error: "Unsupported currency" }, { status: 400 });
  const rate = rates[to] / rates[from];
  return Response.json({ from, to, amount, rate, result: amount * rate, timestamp });
}
The cache is doing a lot of work here. A converter recalculates on every keystroke in the amount field, and a page might show a dozen pairs at once, but none of that needs a new request, because one table answers all of it. With the cache, your API usage depends on how often the table expires, not on how many people use the page. On a 100-request free plan that difference is everything.
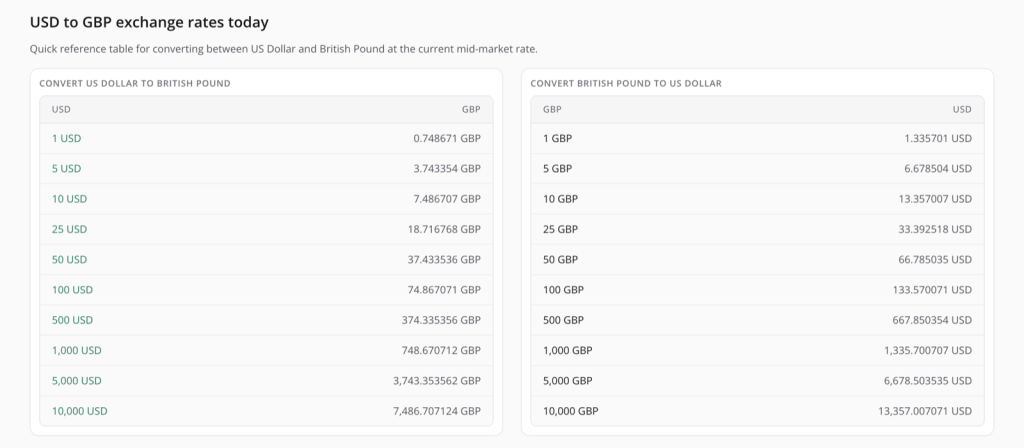
Twenty conversions on one page, from the same cached table and zero extra API calls. The reverse table is just 1 / rate: 1 / 0.748671 ≈ 1.3357.
On a paid plan you can skip the division by passing base=USD, or call convert with from, to and amount directly. Both are convenient, but the single cached table is still the cheaper design, because one request covers every pair.
How do you show historical rates and charts?
You request rates for past dates. On every plan, putting a date in the path returns the rates for that day, and on Professional and above, timeseries returns every day between a start and end date in one request, which is what a chart needs.
A single historical day looks just like latest, with an extra “historical”: true flag:
curl "http://api.exchangeratesapi.io/v1/2026-11-02?access_key=YOUR_KEY&symbols=USD,GBP"
					{
  "success": true,
  "timestamp": 1793663999,
  "historical": true,
  "base": "EUR",
  "date": "2026-11-02",
  "rates": { "USD": 1.119074, "GBP": 0.834554 }
}
For a 12-month chart, one timeseries call with start_date, end_date, base and symbols returns a rate per day, keyed by date. A year of daily points is a lot for a small chart, so group them before you draw. Thirty buckets of about twelve days each, with the first, last, highest and lowest rate in each bucket, gives you a clean candlestick chart that still shows the real highs and lows. Cache it for hours rather than minutes, because yesterday’s rates will never change.
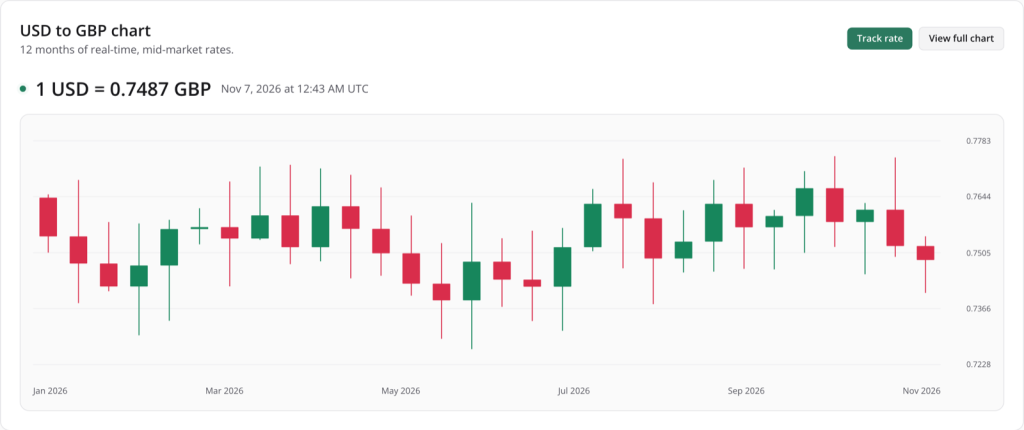
A year of daily USD/GBP rates grouped into about 30 candles. Each candle’s wick is the real high and low of its bucket, so grouping doesn’t hide spikes.
For the “up 0.27% this week” labels you see on finance sites, the fluctuation endpoint does the maths for you. Here’s a real response for the week to 5 November:
					{
  "success": true,
  "fluctuation": true,
  "start_date": "2026-10-29",
  "end_date": "2026-11-05",
  "base": "EUR",
  "rates": {
    "USD": { "start_rate": 1.118218, "end_rate": 1.121265, "change": 0.003, "change_pct": 0.2725 },
    "GBP": { "start_rate": 0.835851, "end_rate": 0.83324, "change": -0.0026, "change_pct": -0.3124 }
  }
}
On plans without fluctuation, you can get the same numbers from two historical calls, or from the first and last points of a time series you’ve already fetched for the chart.
Why is the rate different from what my bank gives me?
Because banks and money transfer services don’t trade at the mid-market rate. They take that rate, apply a margin, and often add a flat fee too. The margin is the part people miss, since the fee is listed while the margin is hidden inside a slightly worse rate.
The difference is easy to show with the real rate from above. At 1.121265 dollars per euro, 1,000 US dollars is worth about 891.85 euros at the mid-market rate. A provider with a 1% margin gives you a rate of about 1.1325 instead, which works out to roughly 883 euros, so about 9 euros of that transfer went on the margin before any fee.
A converter can turn this into a useful feature. Take the mid-market rate, apply a margin and fee per provider, and show how much the recipient actually gets with each one. If you do this, label the margins clearly as estimates unless you have live quotes from those providers, because real margins change with the amount, the corridor and the day.
How do you default to the visitor’s currency?
You look up the visitor’s IP address with an IP geolocation API and use the currency it returns. A converter that opens on “USD to EUR” for someone in Lagos makes them do the work, while one that opens on “USD to NGN” is useful immediately.
ipstack returns a currency block with every lookup on its paid plans, with the currency code and symbol for the visitor’s country. Read the visitor’s address from the x-forwarded-for header on your server, look it up, and use currency.codeas the default target, keeping the US dollar or euro as the other side. Cache the result per IP for a few hours, fall back to a sensible pair when the lookup fails or the visitor is on a local network, and always let people change it.
How to vibe code the whole tool
With the API understood, an AI coding assistant can write most of this. I’d use one that edits a real project, like Claude Code or Cursor, rather than a chat window, because you’ll iterate on the same files. The details above belong in your prompts. Without them, AI tools tend to call the API on every keystroke, ask for base=USD on a free key and get an error, or put the key in browser code.
Start with the server side:
					Create a Next.js App Router project with TypeScript and Tailwind. Add a GET
route /api/convert?from=&to=&amount= that fetches the full rate table from
http://api.exchangeratesapi.io/v1/latest with EXCHANGERATES_API_KEY from the
environment. The free plan only returns EUR-based rates, so add EUR: 1 to the
table and compute cross rates as rates[to] / rates[from]. Cache the table in
memory for 30 minutes and de-duplicate concurrent refreshes. Errors come back
as an "error" object; return a clear message. Also add /api/symbols that
returns the currency list from the symbols endpoint, cached for a day.
Never send the key to the browser.
Check the numbers by hand once. Pick a pair, divide the two rates from the raw table yourself and compare. Then type quickly into the amount field and watch the network tab: you should see calls to your own route but no new upstream requests until the cache expires.
Then the page:
					Build the home page as a dark dashboard. At the top, a converter with an
amount field, two searchable currency selects (with flags and full names
from /api/symbols) and a swap button. Show the result in large type, the
mid-market rate both ways (1 USD = x EUR and 1 EUR = y USD) and "rates as
of" with the timestamp in the visitor's local time. Below, quick reference
tables for 1, 5, 10, 25, 50, 100, 500, 1,000 and 10,000 in both directions.
Format amounts with Intl.NumberFormat using each currency's usual decimals.
And the chart:
					Add /api/timeseries?base=&to= that calls the timeseries endpoint for the
last 360 days, groups the daily rates into 30 candles (open, high, low,
close) and caches each pair for 6 hours. Draw a candlestick chart for the
selected pair with an SVG, no chart library. If the endpoint isn't available
on the plan, hide the chart instead of showing an error.
Between prompts, read the diff instead of accepting it as is. The parts worth checking are the cross-rate division, where the key is used, and how often the upstream API is really called. If those three are right, everything else is presentation, and you can let the AI iterate on that freely.
Things to sort out before you launch
Get the formatting right, because money that looks wrong feels wrong. Japanese yen has no decimal places, most currencies have two, and a few have three. Intl.NumberFormat with style: “currency” handles this and the local digit grouping for you, so use it everywhere instead of toFixed(2).
Be clear about what the number means. Put a short note near the result saying it’s the mid-market rate for information, and that banks and transfer services will apply their own rates. It’s honest, and it heads off the most common confused question before anyone asks it.
Finally, add a short FAQ below the converter. People ask what the mid-market rate is, how often the rates update and where the data comes from. Answering those on the page helps visitors, and it’s the content search engines are most likely to show.
Wrapping up
The finished converter is one cached rate table and some careful arithmetic: fetch every currency at once, divide one rate by another for cross rates, cache aggressively, keep the key on the server and format amounts properly. The Exchange Rates Data API supplies the rates, history and movement data, and an AI assistant can build the rest in an afternoon once you give it those details.
You can try the finished version at apilayer.com/devtools/global-rates, and get a free key at exchangeratesapi.io.
Explore APILayer Products
Discover APIs for geolocation, finance, aviation, weather, web scraping, AI, and more. Browse APILayer's product catalog to find the right APIs for your application and integrate the data and functionality your project needs.
Explore APILayer ProductsFind the right tools to start building.
Currency API
Stay up to date and read the latest finance articles by apilayer.com. Read today to know more!
Related categories