

In today’s world, businesses operate internationally. Therefore, it has become vital to know currency values in real time. This helps with making quick and informed decisions. Building a currency rate API dashboard for real-time analysis is a smart move. A Currency Rate Dashboard API allows you to track currency value changes easily.
One popular tool for this is Fixer’s Currency Rate Dashboard API. It’s a simple tool that gives real-time and historical exchange rates for over 170 currencies. In this blog post, we’ll explain why real-time currency data is so important. We’ll also introduce you to Fixer’s Currency Rate API. Moreover, we will also show you how to use it to build your currency rate dashboard for real-time analysis.
Table of Contents
Why Do We Need the Currency Rate Dashboards?
Currency rate dashboards are important because they provide a clear view of currency values. They help businesses and investors make better financial decisions.
Dashboards show real-time data, which is crucial in fast-moving markets. This helps businesses react quickly to currency changes. Hence reducing risks and increasing opportunities. Real-time data means investors can make timely investment decisions. Hence taking advantage of the best exchange rates.
How Do We Build a Currency Rate Dashboard Using a Currency API?
Let’s begin building our dashboard step-by-step.
Choosing the Right Tools and Frameworks for Dashboard Development
When creating a dashboard, it’s important to pick the right tools. Angular and React are two popular options for web development.
Angular, made by Google, is a full-featured framework. It has many tools for building complex web apps, like data binding and routing.
React, from Facebook, is simpler and more flexible. It’s great for making interactive interfaces.
When choosing between Angular and React, consider your project needs, team skills, and future updates. Both are good, so pick the one that suits your goals best.
Getting Started With Fixer’s Currency Rate API
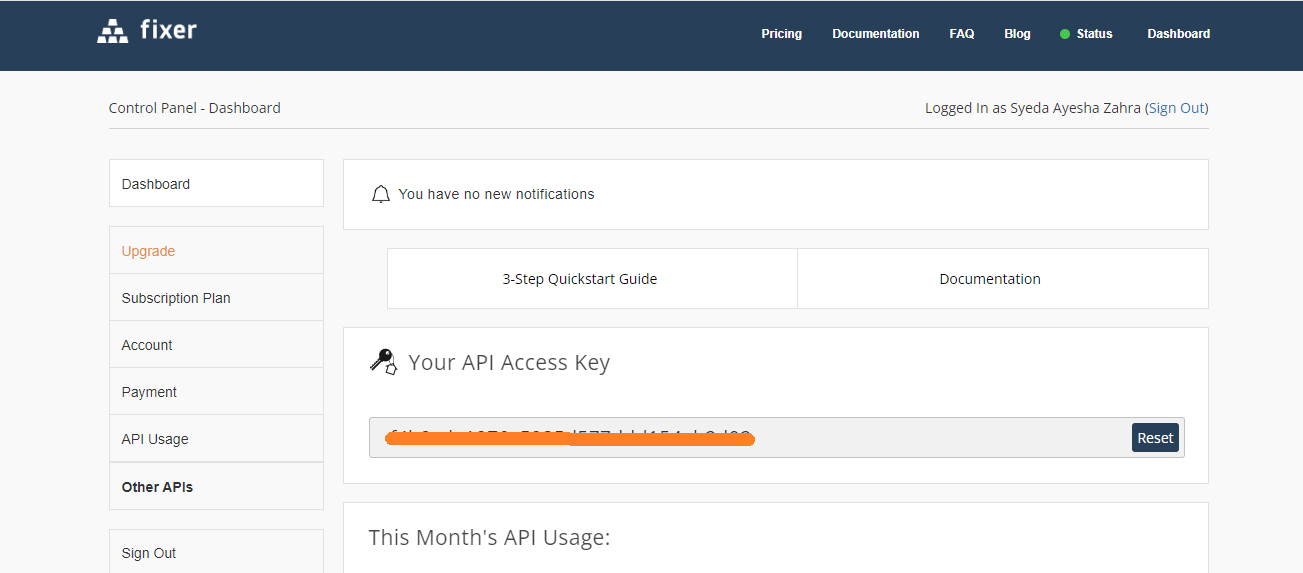
Create an account at the Fixer API’s website.
Next, log in to your account to get the API key. You get this API key at the dashboard.
Fetching and Displaying Currency Data.
Let’s build the currency dashboard. We will use HTML, CSS, and JavaScript to build our application.
Let’s break down each step with the corresponding code snippets:
Setting Up the HTML Structure
|
1 2 3 4 5 6 7 8 9 10 11 12 13 14 15 16 17 18 19 20 21 22 23 24 25 26 27 28 29 30 31 32 33 |
<!DOCTYPE html> <html> <head> <title>Currency Dashboard</title> <link rel="stylesheet" href="https://stackpath.bootstrapcdn.com/bootstrap/4.5.2/css/bootstrap.min.css"> <style> /* CSS styles */ </style> </head> <body> <!-- HTML content --> <script src="https://cdn.jsdelivr.net/npm/chart.js"></script> <script> // JavaScript code </script> </body> </html> |
Adding the Dashboard Content
|
1 2 3 4 5 6 7 8 9 10 11 12 13 14 15 16 17 18 19 20 21 22 23 24 25 26 27 28 29 30 31 32 33 34 35 36 37 |
<div class="container mt-5"> <h1 class="text-center">Fixer Currency Dashboard</h1> <div class="row mt-3"> <div class="col-md-6"> <h3>Real-Time Rates</h3> <!-- Real-time rates table --> </div> <div class="col-md-6"> <h3>Currency Converter</h3> <!-- Currency converter form --> <h3>Historical Rates</h3> <!-- Historical rates form --> <div class="form-group"> <label for="theme-select">Select Theme:</label> <!-- Theme selector dropdown --> </div> </div> </div> </div> |
Fetching and Populating Currency Options
|
1 2 3 4 5 6 7 8 9 10 11 12 |
document.addEventListener('DOMContentLoaded', function() { const API_KEY = 'your_api_key_here'; function populateCurrencies() { fetch(`https://data.fixer.io/api/symbols?access_key=${API_KEY}`) .then(response => response.json()) .then(data => { // Populate base currency and target currencies dropdowns }); } populateCurrencies(); // Other code }); |
Fetching Real-Time Rates
|
1 2 3 4 5 6 7 8 9 10 11 12 13 14 15 16 17 |
const baseCurrencySelect = document.getElementById('base-currency'); baseCurrencySelect.addEventListener('change', function() { const baseCurrency = this.value; fetch(`https://data.fixer.io/api/latest?access_key=${API_KEY}&base=${baseCurrency}`) .then(response => response.json()) .then(data => { // Display real-time rates in a table }); }); |
Converting Currency
|
1 2 3 4 5 6 7 8 9 10 11 12 13 14 15 16 17 18 19 20 21 22 |
const converterForm = document.getElementById('converter-form'); converterForm.addEventListener('submit', function(event) { event.preventDefault(); const fromCurrency = document.getElementById('from-currency').value; const toCurrency = document.getElementById('to-currency').value; const amount = document.getElementById('amount').value; fetch(`https://data.fixer.io/api/convert?access_key=${API_KEY}&from=${fromCurrency}&to=${toCurrency}&amount=${amount}`) .then(response => response.json()) .then(data => { // Display conversion result }); }); |
Plotting Historical Rates
|
1 2 3 4 5 6 7 8 9 10 11 12 13 14 15 16 17 18 19 20 21 22 23 24 25 |
const historicalForm = document.getElementById('historical-form'); historicalForm.addEventListener('submit', function(event) { event.preventDefault(); const startDate = document.getElementById('start-date').value; const endDate = document.getElementById('end-date').value; const baseCurrency = document.getElementById('historical-base-currency').value; const selectedTargetCurrencies = Array.from(document.getElementById('target-currencies').selectedOptions).map(option => option.value); fetch(`https://data.fixer.io/api/timeseries?access_key=${API_KEY}&start_date=${startDate}&end_date=${endDate}&base=${baseCurrency}`) .then(response => response.json()) .then(data => { // Plot historical rates using Chart.js }); }); |
Changing Themes
|
1 2 3 4 5 6 7 8 9 10 11 |
const themeSelect = document.getElementById('theme-select'); const body = document.body; themeSelect.addEventListener('change', function() { const selectedTheme = this.value; body.className = selectedTheme; }); |
Adding a Tutorial Section
|
1 2 3 4 5 6 7 8 9 10 11 12 13 |
<div id="tutorial-section" class="modal"> <div class="modal-content"> <span class="close">×</span> <h2>Welcome to the Fixer Currency Dashboard!</h2> <!-- Tutorial content --> </div> </div> |
Final Touches
|
1 2 3 4 5 6 7 8 9 10 11 12 13 |
document.addEventListener('DOMContentLoaded', function() { const tutorialSection = document.getElementById('tutorial-section'); tutorialSection.style.display = 'block'; const closeButton = document.querySelector('#tutorial-section .close'); closeButton.addEventListener('click', function() { tutorialSection.style.display = 'none'; }); window.addEventListener('click', function(event) { if (event.target == tutorialSection) { tutorialSection.style.display = 'none'; } }); }); |
Here is the GitHub code for our fixer dashboard: https://github.com/devayesha23/Financial_Dashboard
Customization Tips for Better User Experience.
Here are some tips for achieving a better user experience:
✔️Make sure your dashboard looks good on all devices, including phones and tablets.
✔️Keep your dashboard simple and easy to understand. Use white space to separate elements and make important information stand out.
✔️Use the same colors, fonts, and spacing throughout your dashboard for a cohesive look.
✔️Use clear labels and hints in your forms to help users enter information correctly.
✔️Make your charts easy to understand and interact with. Allow users to click on data points for more information.
✔️Show users when data is loading or when an action is being processed.
✔️Display clear error messages and suggestions for fixing them.
✔️Let users customize their experience, such as choosing a default currency or theme.
Currency Rate API Dashboard Final Code
|
1 2 3 4 5 6 7 8 9 10 11 12 13 14 15 16 17 18 19 20 21 22 23 24 25 26 27 28 29 30 31 32 33 34 35 36 37 38 39 40 41 42 43 44 45 46 47 48 49 50 51 52 53 54 55 56 57 58 59 60 61 62 63 64 65 66 67 68 69 70 71 72 73 74 75 76 77 78 79 80 81 82 83 84 85 86 87 88 89 90 91 92 93 94 95 96 97 98 99 100 101 102 103 104 105 106 107 108 109 110 111 112 113 114 115 116 117 118 119 120 121 122 123 124 125 126 127 128 129 130 131 132 133 134 135 136 137 138 139 140 141 142 143 144 145 146 147 148 149 150 151 152 153 154 155 156 157 158 159 160 161 162 163 164 165 166 167 168 169 170 171 172 173 174 175 176 177 178 179 180 181 182 183 184 185 186 187 188 189 190 191 192 193 194 195 196 197 198 199 200 201 202 203 204 205 206 207 208 209 210 211 212 213 214 215 216 217 218 219 220 221 222 223 224 225 226 227 228 229 230 231 232 233 234 235 236 237 238 239 240 241 242 243 244 245 246 247 248 249 250 251 252 253 254 255 256 257 258 259 260 261 262 263 264 265 266 267 268 269 270 271 272 273 274 275 276 277 278 279 280 281 282 283 284 285 286 287 288 289 290 291 292 293 294 295 296 297 298 299 300 301 302 303 304 305 306 307 308 309 310 311 312 313 314 315 316 317 318 319 320 321 322 323 324 325 326 327 328 329 330 331 332 333 334 335 336 337 338 339 340 341 342 343 344 345 346 347 348 349 350 351 352 353 354 355 356 357 358 359 360 361 362 363 364 365 366 367 368 369 370 371 372 373 374 375 376 377 378 379 380 381 382 383 384 385 386 387 388 389 390 391 392 393 394 395 396 397 398 399 400 401 402 403 404 405 406 407 408 409 410 411 412 413 414 415 416 417 418 419 420 421 422 423 424 425 426 427 428 429 430 431 432 433 434 435 436 437 438 439 440 441 442 443 444 445 446 447 448 449 450 451 452 453 454 455 456 457 458 459 460 461 462 463 464 465 466 467 468 469 470 471 472 473 474 475 476 477 478 479 480 481 482 483 484 485 486 487 488 489 490 491 492 493 494 495 496 497 498 499 500 501 502 503 504 505 506 507 508 509 510 511 512 513 514 515 516 517 518 519 520 521 522 523 524 525 526 527 528 529 530 531 532 533 534 535 536 537 538 539 540 541 542 543 544 545 546 547 548 549 550 551 552 553 554 555 556 557 558 559 560 561 562 563 564 565 566 567 568 569 570 571 572 573 574 575 576 577 578 579 580 581 582 583 584 585 586 587 588 589 590 591 592 593 594 595 596 597 598 599 600 601 602 603 604 605 606 607 608 609 610 611 612 613 614 615 616 617 618 619 620 621 622 623 624 625 626 627 628 629 630 631 632 633 634 635 636 637 |
<!DOCTYPE html> <html> <head> <title>Currency Dashboard</title> <link rel="stylesheet" href="https://stackpath.bootstrapcdn.com/bootstrap/4.5.2/css/bootstrap.min.css"> <style> /* Default theme */ body { background-color: #f9f9f9; } .btn-primary { background-color: #007bff; border-color: #007bff; } /* Dark theme */ body.dark { background-color: #333; color: #fff; } body.dark * { color: #fff; /* Set text color to white for all elements */ } body.dark .btn-primary { background-color: #555; border-color: #555; } /* Light theme */ body.light { background-color: #fff; color: #333; } body.light .btn-primary { background-color: #f8f9fa; border-color: #f8f9fa; } .conversion-result { border: 1px solid #ccc; padding: 10px; margin-top: 10px; background-color: #f9f9f9; } .chart-container { max-width: 100%; height: 400px; margin-top: 20px; border: 1px solid #ccc; border-radius: 5px; overflow: hidden; } #historical-chart { width: 100%; height: 100%; } #tutorial-section { display: none; position: fixed; z-index: 1; left: 0; top: 0; width: 100%; height: 100%; overflow: auto; background-color: rgba(0,0,0,0.4); } #tutorial-section .modal-content { background-color: #507EB1; margin: 15% auto; padding: 20px; border: 1px solid #888; width: 80%; color: whitesmoke; } #tutorial-section .close { color: #aaa; float: right; font-size: 28px; font-weight: bold; } #tutorial-section .close:hover, #tutorial-section .close:focus { color: black; text-decoration: none; cursor: pointer; } </style> </head> <body> <div class="container mt-5"> <h1 class="text-center">Fixer Currency Dashboard</h1> <div class="row mt-3"> <div class="col-md-6"> <h3>Real-Time Rates</h3> <div class="form-group"> <label for="base-currency">Base Currency</label> <select class="form-control" id="base-currency"> <!-- Options will be populated dynamically --> </select> </div> <table class="table"> <thead> <tr> <th>Currency</th> <th>Rate</th> </tr> </thead> <tbody id="realtime-rates"></tbody> </table> </div> <div class="col-md-6"> <h3>Currency Converter</h3> <form id="converter-form"> <div class="form-group"> <label for="from-currency">From Currency</label> <input type="text" class="form-control" id="from-currency" placeholder="Enter currency code"> </div> <div class="form-group"> <label for="to-currency">To Currency</label> <input type="text" class="form-control" id="to-currency" placeholder="Enter currency code"> </div> <div class="form-group"> <label for="amount">Amount</label> <input type="text" class="form-control" id="amount" placeholder="Enter amount"> </div> <button type="submit" class="btn btn-primary">Convert</button> </form> <div id="conversion-result" class="conversion-result"></div> <h3>Historical Rates</h3> <form id="historical-form"> <div class="form-group"> <label for="start-date">Start Date</label> <input type="date" class="form-control" id="start-date"> </div> <div class="form-group"> <label for="end-date">End Date</label> <input type="date" class="form-control" id="end-date"> </div> <div class="form-group"> <label for="historical-base-currency">Base Currency</label> <select class="form-control" id="historical-base-currency"> <!-- Options will be populated dynamically --> </select> </div> <div class="form-group"> <label for="target-currencies">Target Currencies</label> <select multiple class="form-control" id="target-currencies"> <!-- Options will be populated dynamically --> </select> </div> <button type="submit" class="btn btn-primary">Plot Chart</button> </form> <div class="form-group"> <label for="chart-display">Select Chart Display:</label> <select class="form-control" id="chart-display"> <option value="line">Line Chart</option> <option value="bar">Bar Chart</option> <option value="radar">Radar Chart</option> </select> </div> <div id="chart-container" class="chart-container"> <canvas id="historical-chart"></canvas> </div> <div class="form-group"> <label for="theme-select">Select Theme:</label> <select class="form-control" id="theme-select"> <option value="default">Default</option> <option value="dark">Dark</option> <option value="light">Light</option> </select> </div> </div> </div> </div> <div id="tutorial-section" class="modal"> <div class="modal-content"> <span class="close">×</span> <h2>Welcome to the Fixer Currency Dashboard!</h2> <p>This dashboard lets you check real-time rates for selected currencies, convert currencies, and plot historical currency rates.</p> <h3>Adding New Currency Pairs</h3> <p>To add new currency pairs, select the base currency from the dropdown list, and the real-time rates for the selected base currency will be displayed in the table.</p> <h3>Interpreting the Data</h3> <p>The table shows the currency code and the corresponding exchange rate. Use the currency converter to convert between currencies, and use the historical rates form to plot historical exchange rates.</p> <h3>Changing the Theme</h3> <p>To change the theme, you get light mode and dark mode options. Choose your preferred theme just under the historical plots</p> </div> </div> <script src="https://cdn.jsdelivr.net/npm/chart.js"></script> <script> document.addEventListener('DOMContentLoaded', function() { const API_KEY = '43ca5faebc7d179a5d05fc6969b3f340'; // Function to fetch and populate base currency and target currencies function populateCurrencies() { fetch(`https://data.fixer.io/api/symbols?access_key=${API_KEY}`) .then(response => response.json()) .then(data => { const symbols = data.symbols; const baseCurrencySelect = document.getElementById('base-currency'); const historicalBaseCurrencySelect = document.getElementById('historical-base-currency'); const targetCurrenciesSelect = document.getElementById('target-currencies'); baseCurrencySelect.innerHTML = ''; historicalBaseCurrencySelect.innerHTML = ''; targetCurrenciesSelect.innerHTML = ''; for (const symbol in symbols) { const option = `<option value="${symbol}">${symbol} - ${symbols[symbol]}</option>`; baseCurrencySelect.insertAdjacentHTML('beforeend', option); historicalBaseCurrencySelect.insertAdjacentHTML('beforeend', option); targetCurrenciesSelect.insertAdjacentHTML('beforeend', option); } }); } populateCurrencies(); // Fetch real-time rates based on selected base currency const baseCurrencySelect = document.getElementById('base-currency'); baseCurrencySelect.addEventListener('change', function() { const baseCurrency = this.value; fetch(`https://data.fixer.io/api/latest?access_key=${API_KEY}&base=${baseCurrency}`) .then(response => response.json()) .then(data => { const rates = data.rates; const realtimeRatesElement = document.getElementById('realtime-rates'); realtimeRatesElement.innerHTML = ''; for (const currency in rates) { const rate = rates[currency]; const row = `<tr><td>${currency}</td><td>${rate}</td></tr>`; realtimeRatesElement.insertAdjacentHTML('beforeend', row); } }); }); // Convert currency const converterForm = document.getElementById('converter-form'); converterForm.addEventListener('submit', function(event) { event.preventDefault(); const fromCurrency = document.getElementById('from-currency').value; const toCurrency = document.getElementById('to-currency').value; const amount = document.getElementById('amount').value; fetch(`https://data.fixer.io/api/convert?access_key=${API_KEY}&from=${fromCurrency}&to=${toCurrency}&amount=${amount}`) .then(response => response.json()) .then(data => { const result = data.result; const conversionResultElement = document.getElementById('conversion-result'); conversionResultElement.innerHTML = `<div class="conversion-result"><p>${amount} ${fromCurrency} is equal to ${result} ${toCurrency}</p></div>`; }); }); // Plot historical rates chart const historicalForm = document.getElementById('historical-form'); historicalForm.addEventListener('submit', function(event) { event.preventDefault(); const startDate = document.getElementById('start-date').value; const endDate = document.getElementById('end-date').value; const baseCurrency = document.getElementById('historical-base-currency').value; const selectedTargetCurrencies = Array.from(document.getElementById('target-currencies').selectedOptions).map(option => option.value); fetch(`https://data.fixer.io/api/timeseries?access_key=${API_KEY}&start_date=${startDate}&end_date=${endDate}&base=${baseCurrency}`) .then(response => response.json()) .then(data => { if (!data || !data.rates) { console.error('Error fetching historical rates:', data); return; } const rates = data.rates; const labels = Object.keys(rates); const datasets = selectedTargetCurrencies.map(currency => { const dataPoints = labels.map(label => rates[label][currency]); return { label: currency, data: dataPoints }; }); let historicalChart = null; function updateChartDisplay(chartType) { const ctx = document.getElementById('historical-chart').getContext('2d'); if (historicalChart) { historicalChart.destroy(); } if (chartType === 'line' || chartType === 'bar' || chartType === 'radar') { historicalChart = new Chart(ctx, { type: chartType, data: { labels: labels, datasets: datasets }, options: { responsive: true, maintainAspectRatio: false } }); } } const chartDisplaySelect = document.getElementById('chart-display'); chartDisplaySelect.addEventListener('change', function() { const chartType = this.value; updateChartDisplay(chartType); }); updateChartDisplay('line'); }) .catch(error => { console.error('Error fetching historical rates:', error); }); }); const themeSelect = document.getElementById('theme-select'); const body = document.body; themeSelect.addEventListener('change', function() { const selectedTheme = this.value; body.className = selectedTheme; }); }); document.addEventListener('DOMContentLoaded', function() { const tutorialSection = document.getElementById('tutorial-section'); tutorialSection.style.display = 'block'; const closeButton = document.querySelector('#tutorial-section .close'); closeButton.addEventListener('click', function() { tutorialSection.style.display = 'none'; }); window.addEventListener('click', function(event) { if (event.target == tutorialSection) { tutorialSection.style.display = 'none'; } }); }); </script> </body> </html> |
Output Of Currency Rate API Dashboard
When you run the above code, it will show you a web page with a tutorial section popping on the screen.
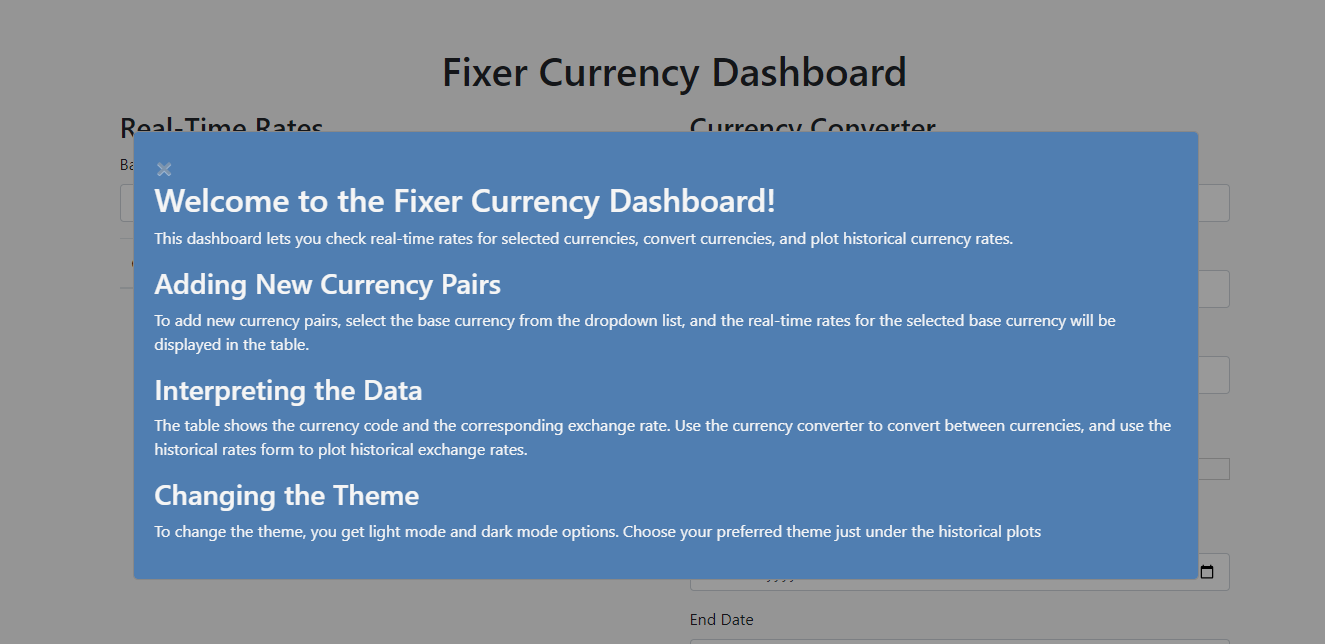
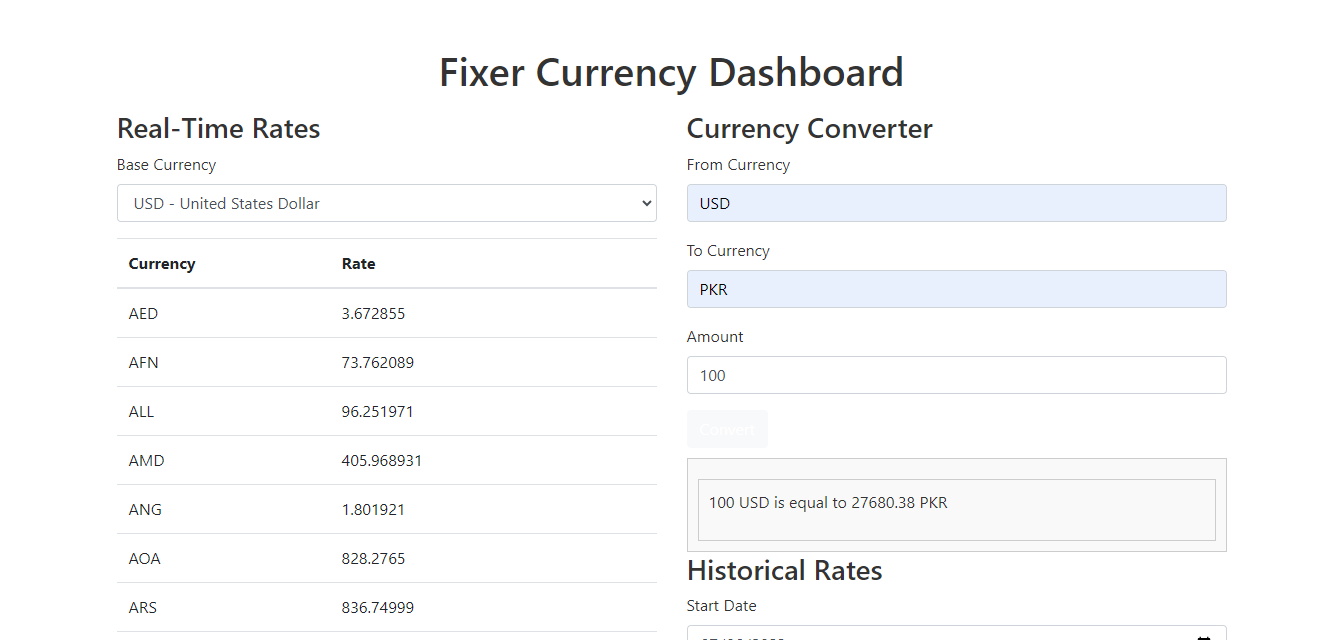
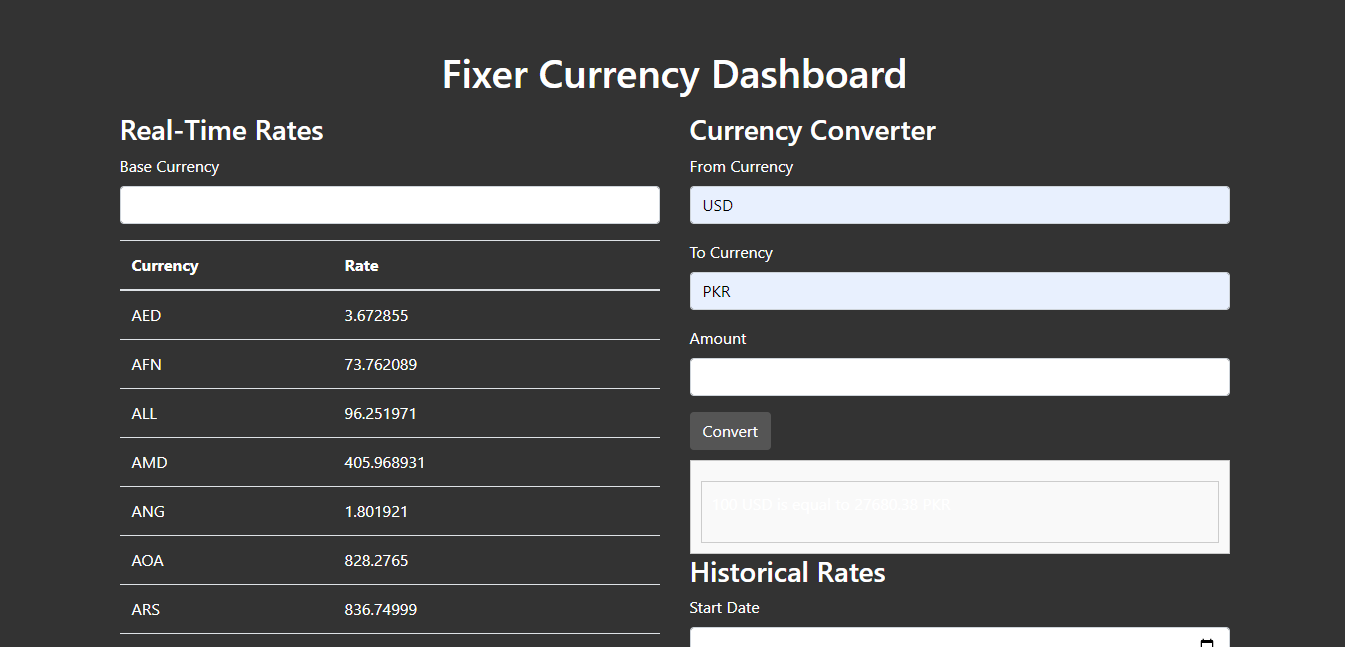
The above tutorial tells how to use our Fixer Currency Dashboard. Click on the cross sign given in the top left corner to close the tutorial section. Now, you can see the below screen.
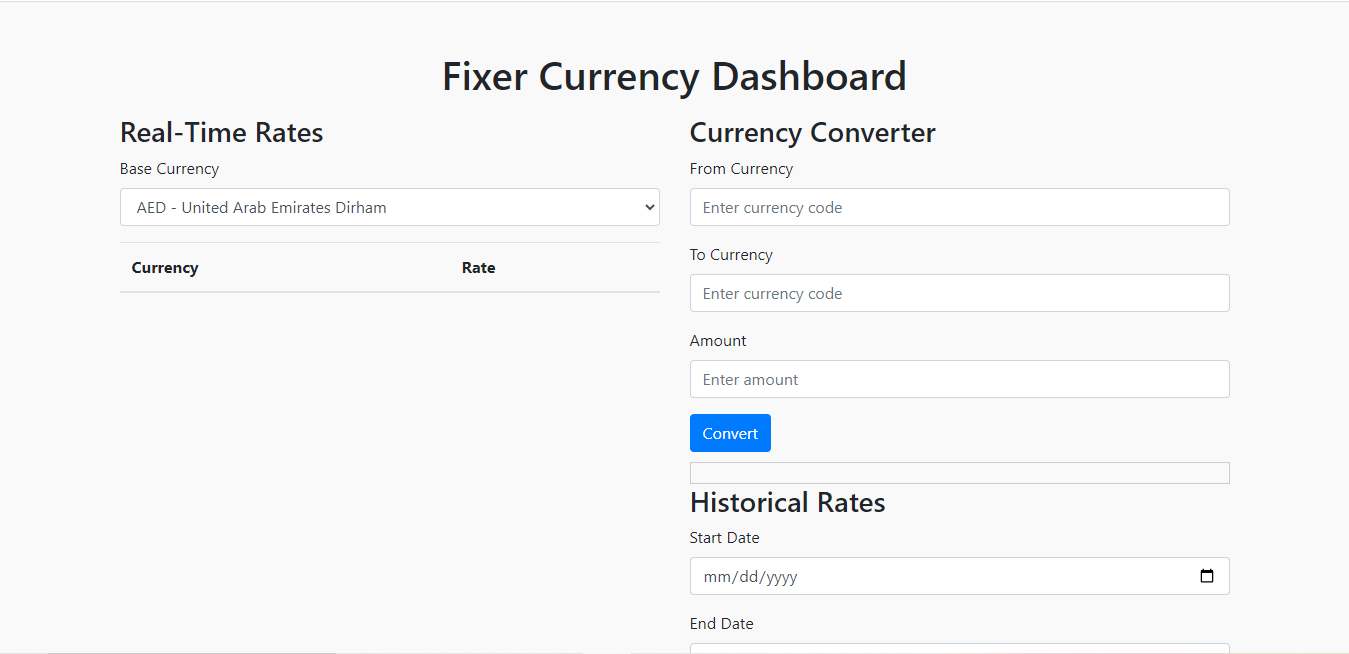
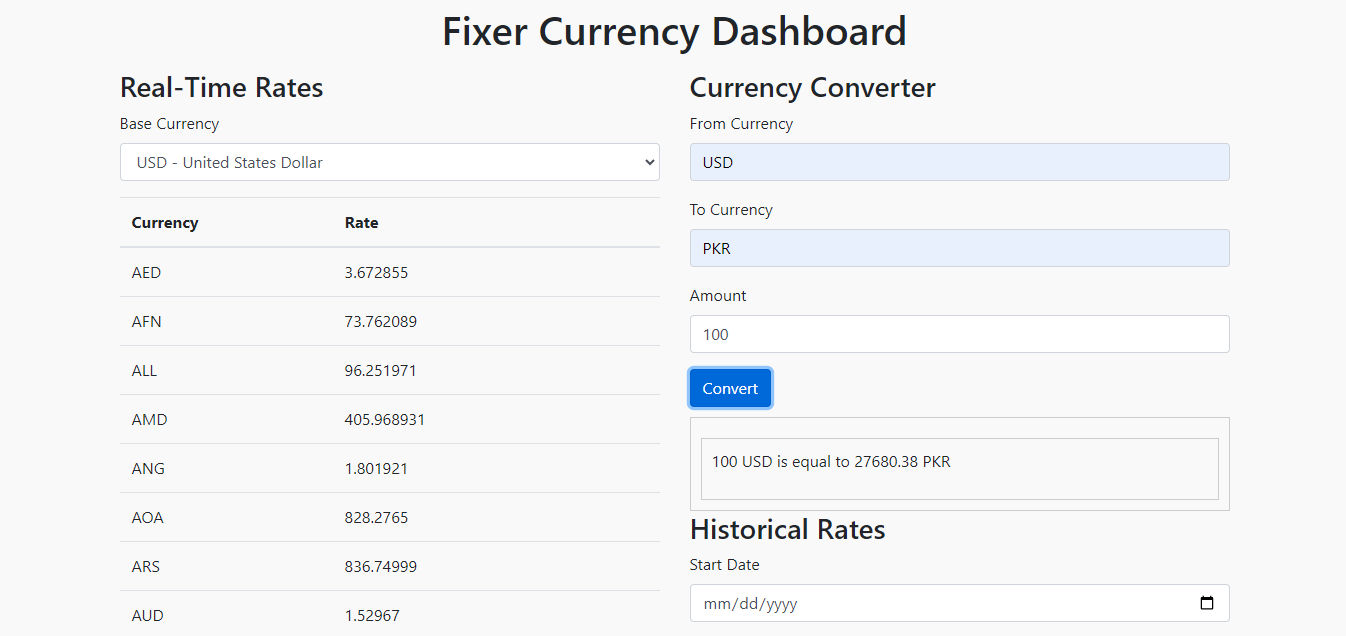
You should select the base currency to fetch real time updates. Let’s select USD and see the real time rates.
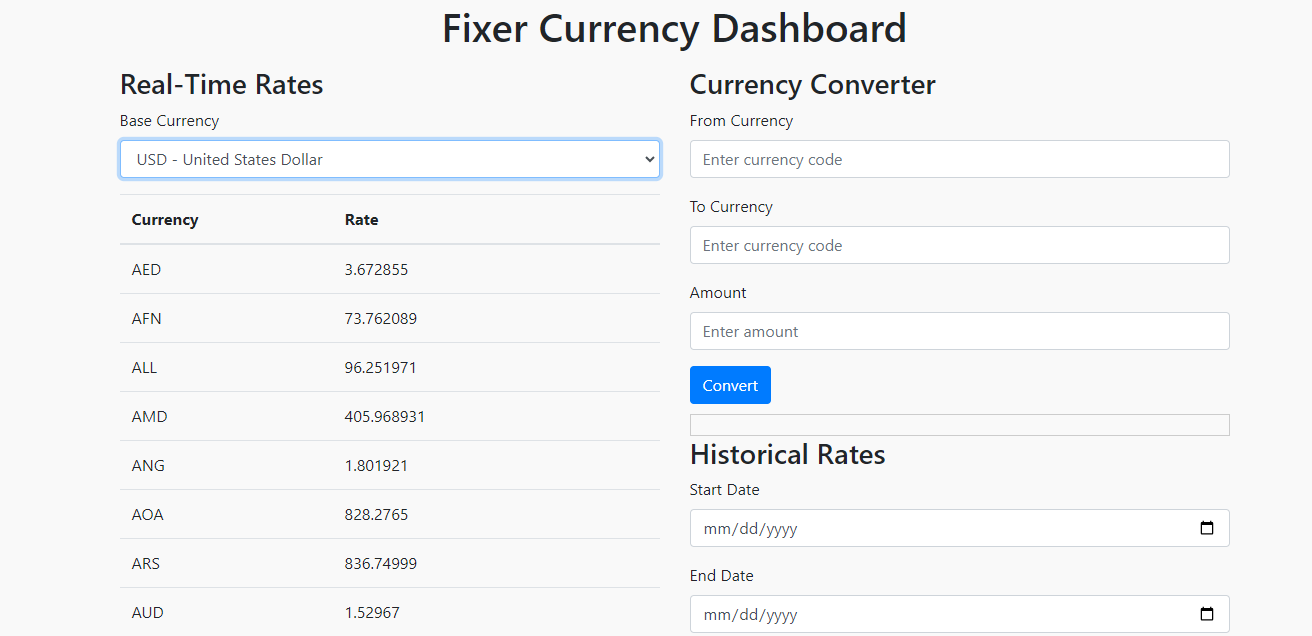
These rates come with a complete list that you can check by scrolling down the screen. Let’s try converting currency through our currency converter section. You should enter the target and base currency, and the amount required. Here are the results for converting 100 US dollars to PKR.
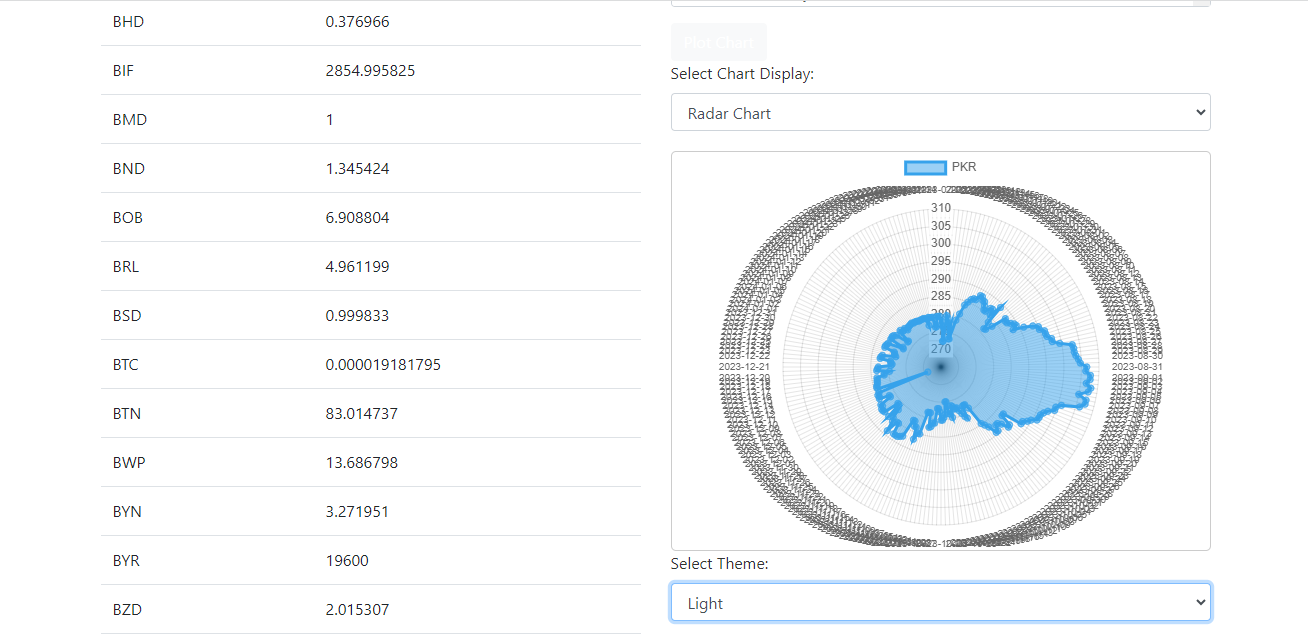
Let’s try the historial rates charts. You should select the starting and ending date with the base and target currency. We have three options; line chart, bar chart, and radar chart. Select your preferred chart.
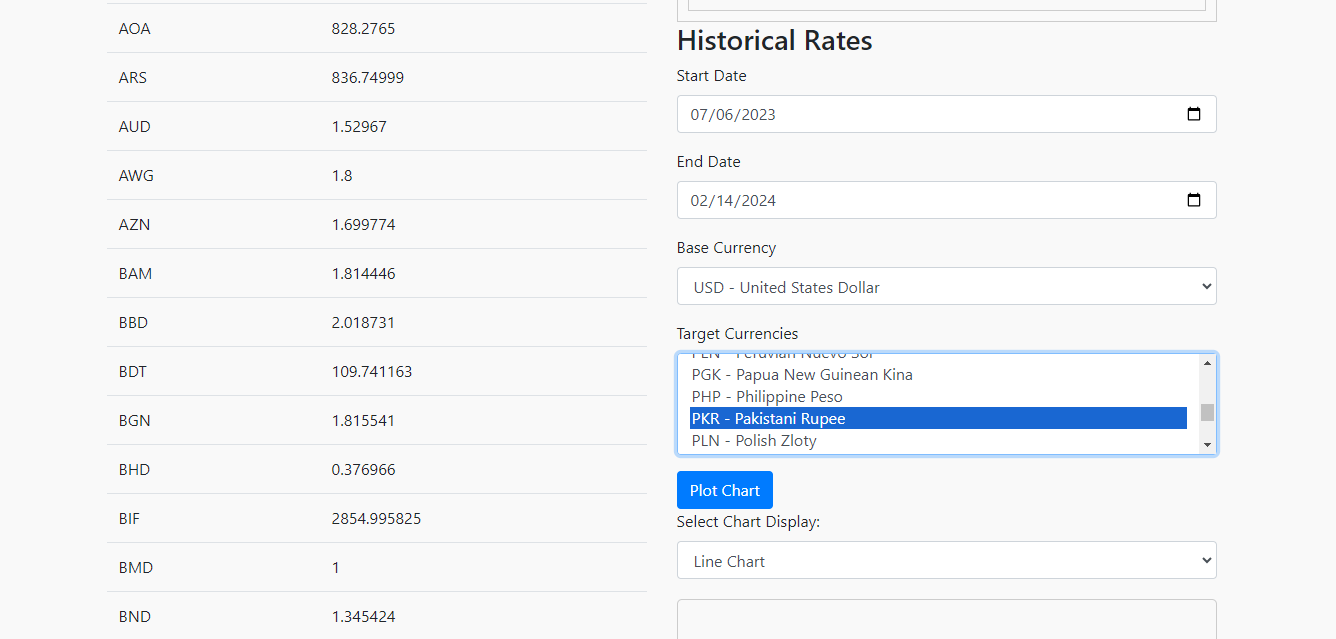
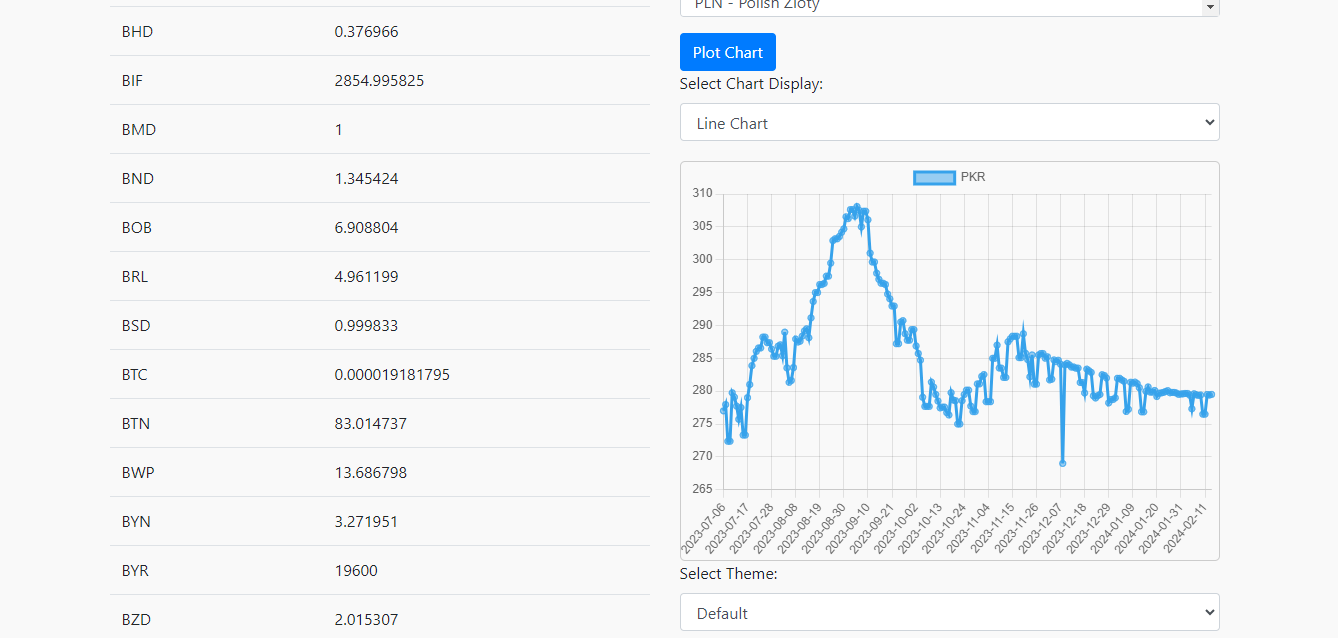
When you click on the Plot Chart button, here are the results. We have shown the results for each chart type:
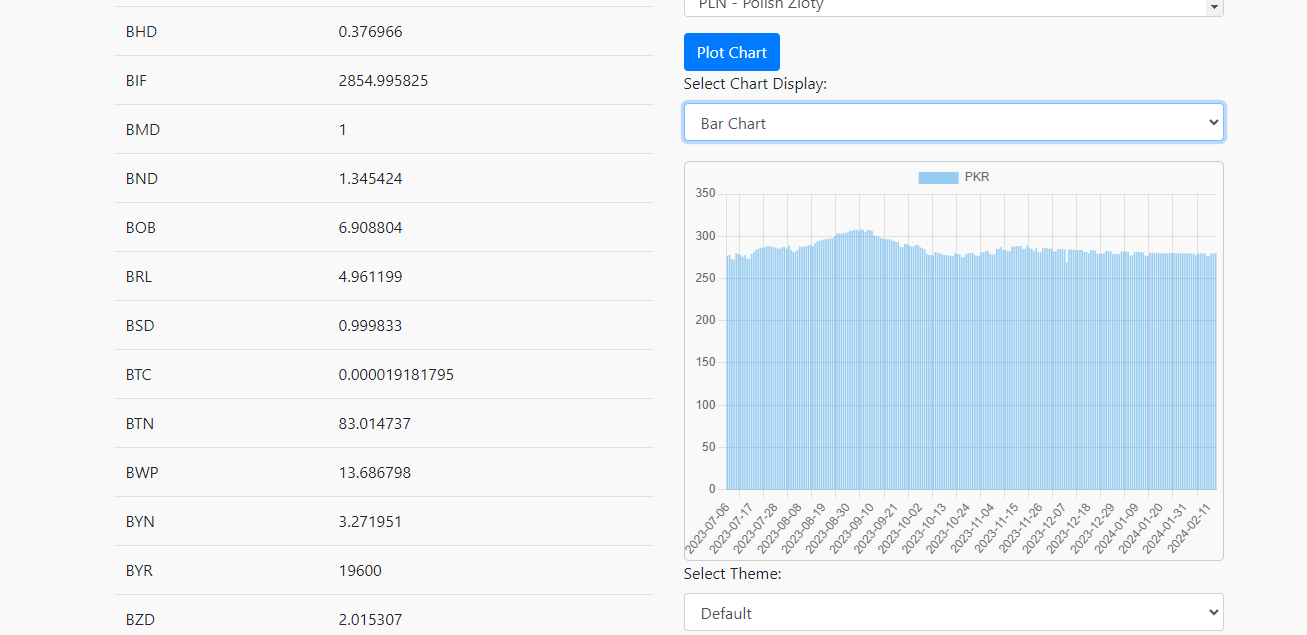
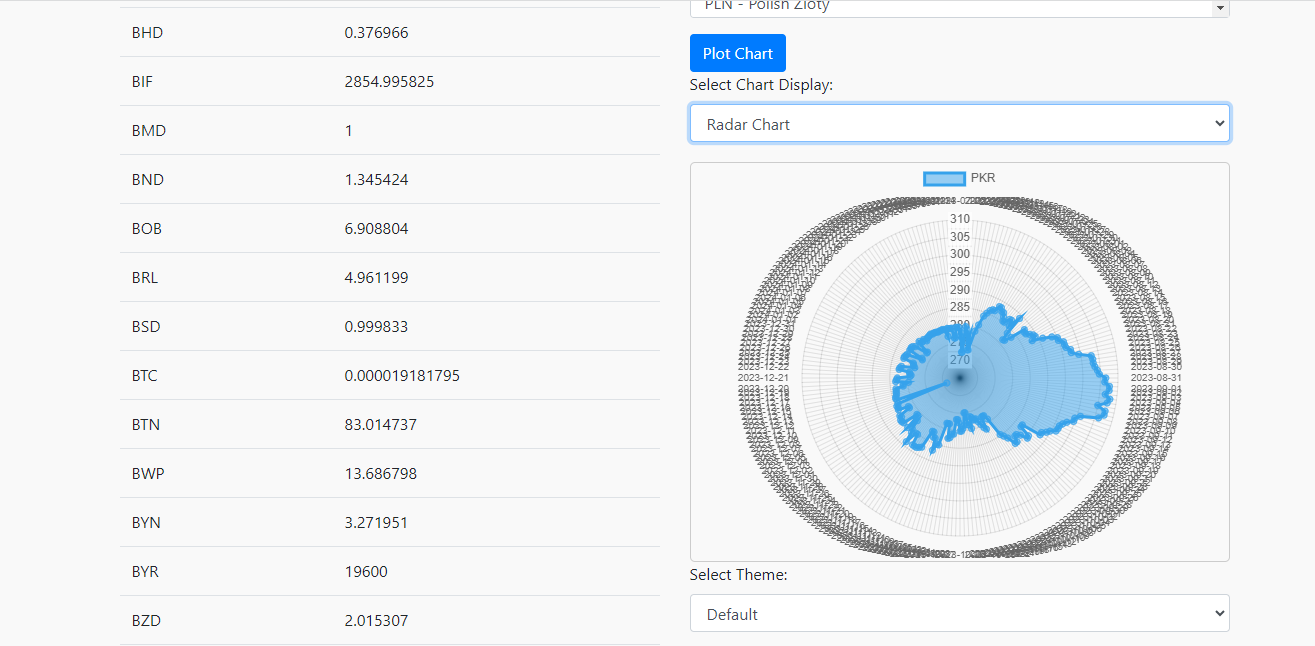
You must note that you can check the rates when you bring the arrow to a particular point. Here is an example:
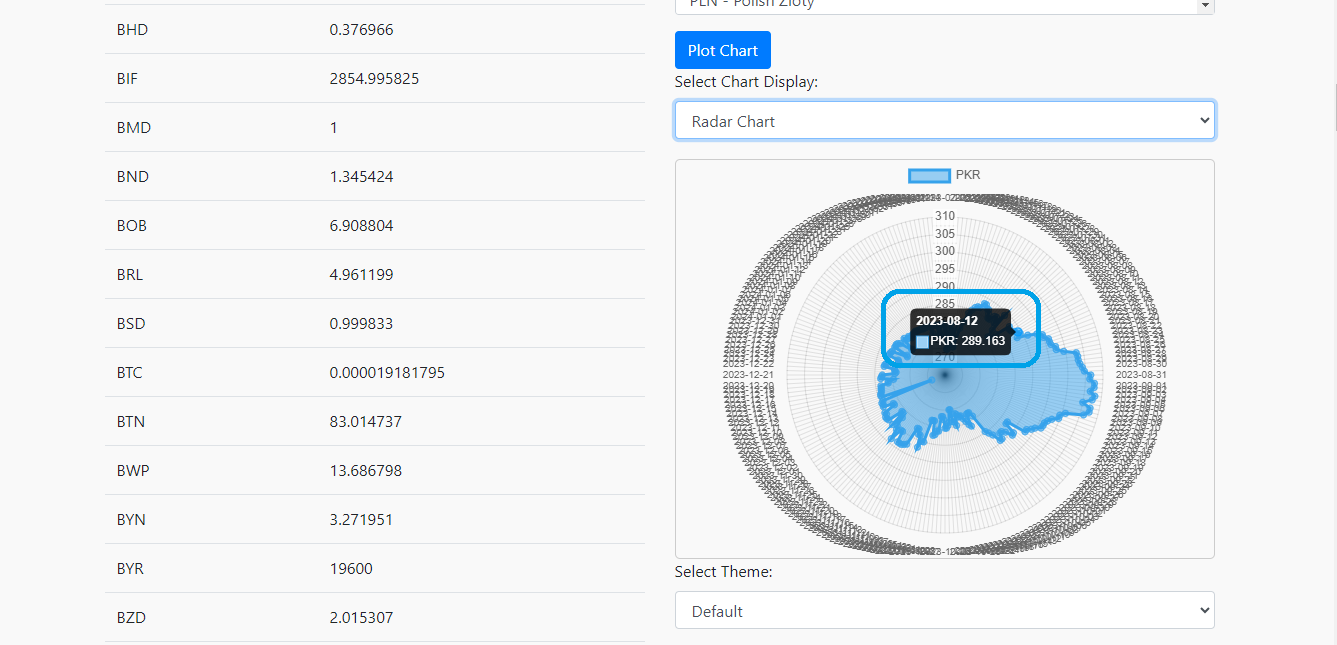
The same feature also works for the line and bar charts.
Our dashboard gives you a historical plot for the last 365 days.
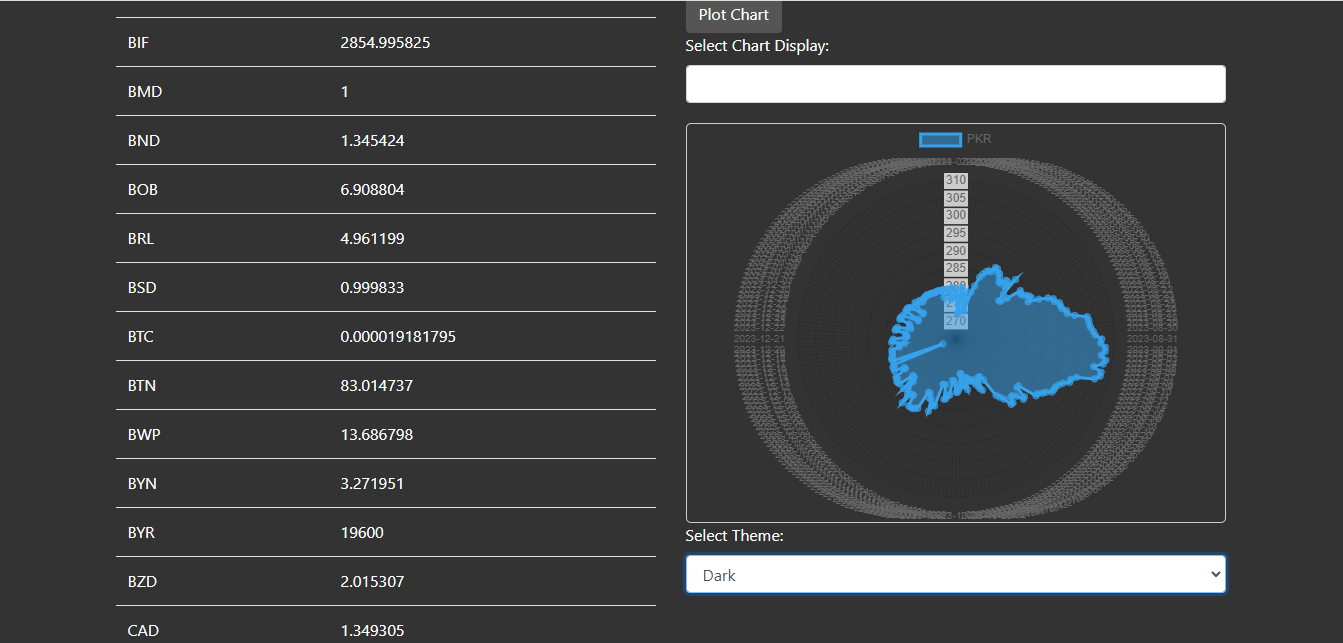
Finally, there is also a feature to change the theme of our dashboard. You can find it under the Select Theme section.
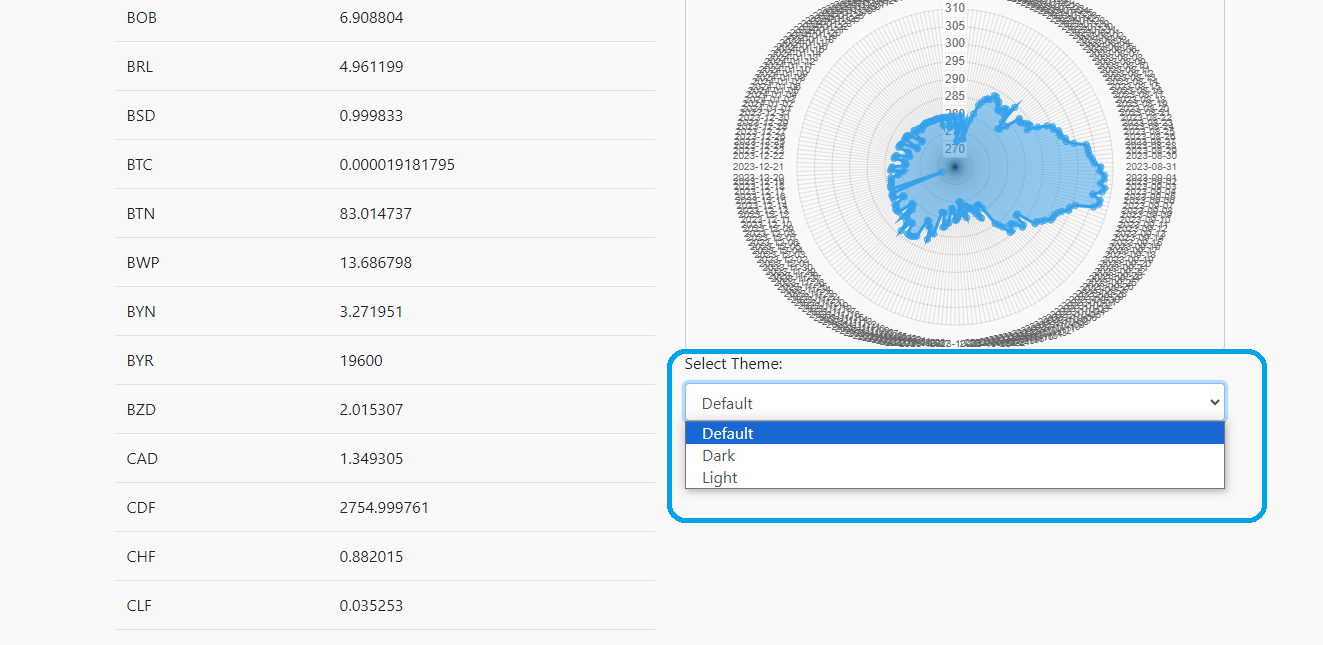
Here is the light theme:
Here is the dark theme:
How Do Businesses Leverage Real-Time Data for Strategic Advantages?
Businesses use real-time data to make quick decisions, improve customer experiences, and run operations smoothly. Here’s how they do it:
✔️Real-time data helps businesses make fast decisions based on current information.
✔️Businesses can use real-time data to personalize customer interactions and solve issues quickly.
✔️Real-time data helps monitor and improve processes like inventory management and production schedules.
✔️Access to real-time market data helps businesses respond quickly to changes and stay ahead of competitors.
✔️Real-time data helps identify and manage risks like fraud and security breaches.
✔️Real-time data helps track marketing campaign performance and make adjustments for better results.
✔️Real-time financial data helps in accurate forecasting and adjusting financial strategies as needed.
Currency Rate API Dashboard: Conclusion
Creating a currency rate dashboard for real-time analysis is crucial for businesses that operate globally. It helps them monitor currency value changes easily and make quick decisions. Fixer’s Currency Rate API is a useful tool for accessing real-time and historical exchange rates for over 170 currencies.
Businesses can improve their financial strategies, manage risks effectively, and stay competitive. Real-time data allows businesses to adapt quickly to market changes. Hence, leading to better financial outcomes and strategic advantages in today’s global economy.
Currency Rate API Dashboard: FAQs
How Often Is Currency Rate API Data Updated in Fixer’s API?
Currency data in Fixer’s API gets updated every hour. This means you’ll get the latest exchange rates for different currencies each time you ask for them.
Can I Use Fixer’s Currency Rate API for Historical Currency Rate Analysis?
Yes. You can use Fixer’s API dashboard to look at how currency rates have changed over time.
Is There a Limit to How Many Currency Pairs I Can Track With the Dashboard?
It depends on the API you’re using and how you’ve set up your app. Most APIs have rules on how many requests you can make in a certain time. You should check the API’s documentation to know its limits.
Is It Secure to Use the Fixer Currency Rate API?
The Fixer API can be safe if you follow some basic rules. It needs an API key for access, which helps track who’s using it and stops unauthorized access. It also uses HTTPS, which makes sure that data sent between you and the API is secure. But, just like with any API, how secure your app is also depends on how you handle the data you get from the API.